Estimated Value: $847,000 - $993,000
4
Beds
5
Baths
3,600
Sq Ft
$260/Sq Ft
Est. Value
About This Home
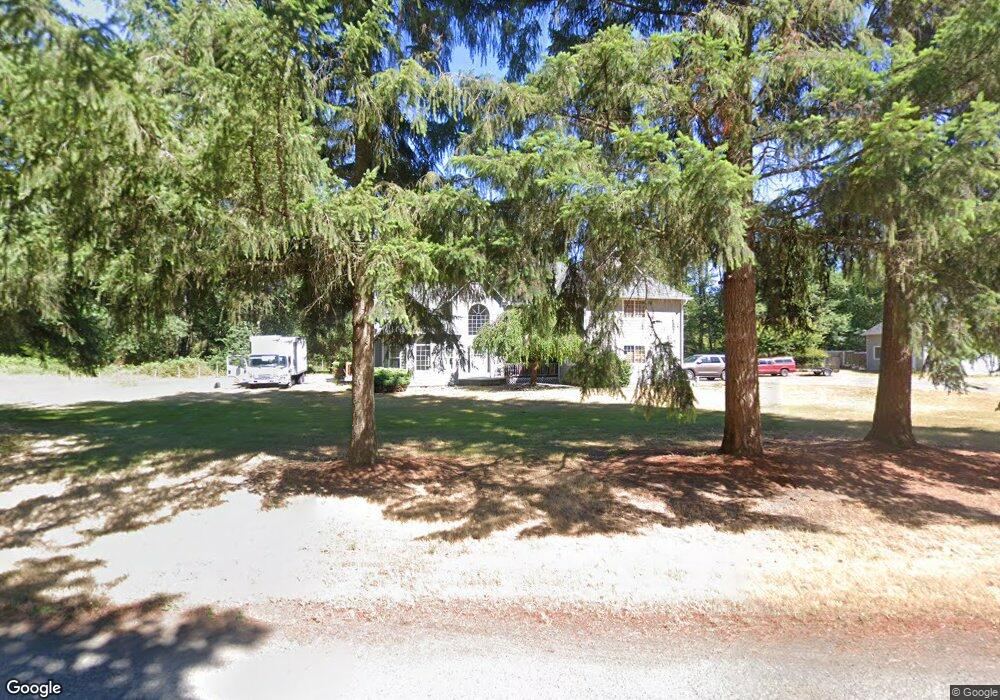
This home is located at 21922 Hobson Rd SE, Yelm, WA 98597 and is currently estimated at $935,303, approximately $259 per square foot. 21922 Hobson Rd SE is a home located in Thurston County with nearby schools including Lackamas Elementary School, Ridgeline Middle School, and Yelm High School.
Ownership History
Date
Name
Owned For
Owner Type
Purchase Details
Closed on
Nov 23, 2003
Sold by
Ellis Kathryn A
Bought by
Kertzman Fredrick B and Kertzman Victoria R
Current Estimated Value
Home Financials for this Owner
Home Financials are based on the most recent Mortgage that was taken out on this home.
Original Mortgage
$314,900
Interest Rate
6%
Mortgage Type
Balloon
Purchase Details
Closed on
Mar 8, 1999
Sold by
Westlands Resources Corp
Bought by
Foster Robert C and Foster Colleen K
Purchase Details
Closed on
Mar 24, 1998
Sold by
Hawker John A and Hawker Merribeth
Bought by
Westlands Resources Corp
Create a Home Valuation Report for This Property
The Home Valuation Report is an in-depth analysis detailing your home's value as well as a comparison with similar homes in the area
Home Values in the Area
Average Home Value in this Area
Purchase History
| Date | Buyer | Sale Price | Title Company |
|---|---|---|---|
| Kertzman Fredrick B | $407,073 | First American Title | |
| Foster Robert C | -- | First American Title Ins Co | |
| Westlands Resources Corp | -- | First American Title Ins Co |
Source: Public Records
Mortgage History
| Date | Status | Borrower | Loan Amount |
|---|---|---|---|
| Closed | Kertzman Fredrick B | $314,900 |
Source: Public Records
Tax History Compared to Growth
Tax History
| Year | Tax Paid | Tax Assessment Tax Assessment Total Assessment is a certain percentage of the fair market value that is determined by local assessors to be the total taxable value of land and additions on the property. | Land | Improvement |
|---|---|---|---|---|
| 2024 | $7,323 | $899,200 | $171,900 | $727,300 |
| 2023 | $7,323 | $794,300 | $164,100 | $630,200 |
| 2022 | $7,382 | $876,100 | $110,100 | $766,000 |
| 2021 | $7,533 | $697,900 | $122,600 | $575,300 |
| 2020 | $7,023 | $603,700 | $76,500 | $527,200 |
| 2019 | $5,824 | $550,400 | $63,700 | $486,700 |
| 2018 | $7,209 | $539,400 | $60,400 | $479,000 |
| 2017 | $7,470 | $578,350 | $57,550 | $520,800 |
| 2016 | $5,676 | $465,600 | $63,600 | $402,000 |
| 2014 | -- | $410,800 | $65,000 | $345,800 |
Source: Public Records
Map
Nearby Homes
- 22030 Piessner Rd SE
- 14831 Rainier View Dr SE
- 21648 N Terra Ln SE
- 21715 E Terra Ln SE
- 21521 W Terra Ln SE
- 21737 E Terra Ln SE
- 17519 Loop Ln SE
- 17504 Loop Ln SE
- 17502 Clear Lake Blvd SE
- 0 173rd Ave SE Unit NWM2442565
- 17538 Loop Ln SE
- 21734 N Clear Lake Blvd SE
- 22041 Clear Lake Blvd SE
- 17616 Vine Ln NE
- 19836 161st St SE
- 22213 N Clear Lake Blvd SE
- 22145 N Clear Lake Blvd SE
- 22137 Clear Lake Blvd SE
- 17614 Clearlake Blvd SE
- 17636 E Clear Lake Blvd SE
- 21928 Hobson Rd SE
- 21920 Hobson Rd SE
- 21734 Hobson Rd SE
- 21841 Hobson Rd SE
- 21738 Hobson Rd SE
- 21730 Hobson Rd SE
- 21720 Hobson Rd SE
- 21721 Hobson Rd SE
- 22200 Hobson Rd SE
- 21722 Hobson Rd SE
- 21601 Hobson Rd SE
- 21626 Hobson Rd SE
- 0 Hobson Rd SE
- 16100 Lemuria Ln SE
- 21744 Hobson Rd SE
- 15515 Castle Ln SE
- 21530 Hobson Rd SE
- 21728 Hobson Rd SE
- 21536 Hobson Rd SE