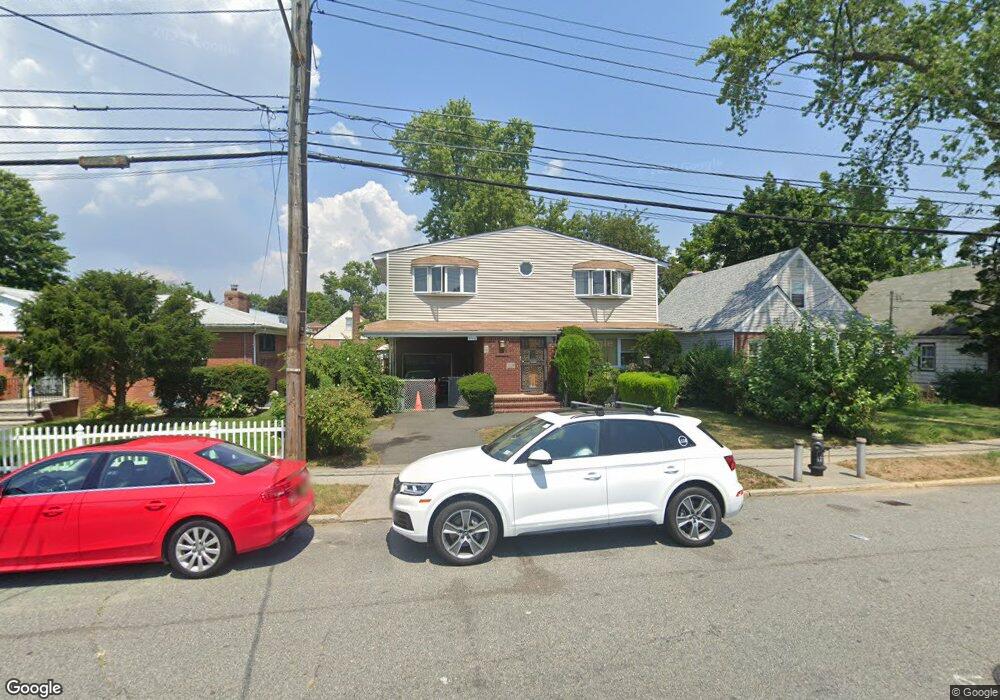
21927 112th Rd Queens Village, NY 11429
Queens Village NeighborhoodEstimated Value: $842,569 - $1,061,000
--
Bed
--
Bath
1,908
Sq Ft
$518/Sq Ft
Est. Value
About This Home
This home is located at 21927 112th Rd, Queens Village, NY 11429 and is currently estimated at $988,642, approximately $518 per square foot. 21927 112th Rd is a home located in Queens County with nearby schools including P.S./M.S. 147 Ronald Mcnair, I.S. 192 The Linden, and Ss Joachim & Anne School.
Ownership History
Date
Name
Owned For
Owner Type
Purchase Details
Closed on
Dec 30, 2024
Sold by
Buxton-Sinclair April and Sinclair Vincent
Bought by
April Buxton-Sinclair Family Trust and Sinclair Vincent James
Current Estimated Value
Purchase Details
Closed on
Dec 18, 2008
Sold by
Buxton-Sinclair April
Bought by
Buxton-Sinclair April and Sinclair Vincent
Home Financials for this Owner
Home Financials are based on the most recent Mortgage that was taken out on this home.
Original Mortgage
$432,437
Interest Rate
5.25%
Mortgage Type
Commercial
Purchase Details
Closed on
Dec 1, 2008
Sold by
Buxton-Sinclair April and Clarke Sheila A
Bought by
Buxton-Sinclair April
Home Financials for this Owner
Home Financials are based on the most recent Mortgage that was taken out on this home.
Original Mortgage
$432,437
Interest Rate
5.25%
Mortgage Type
Commercial
Create a Home Valuation Report for This Property
The Home Valuation Report is an in-depth analysis detailing your home's value as well as a comparison with similar homes in the area
Home Values in the Area
Average Home Value in this Area
Purchase History
| Date | Buyer | Sale Price | Title Company |
|---|---|---|---|
| April Buxton-Sinclair Family Trust | -- | -- | |
| Buxton-Sinclair April | -- | -- | |
| Buxton-Sinclair April | -- | -- | |
| Buxton-Sinclair April | -- | -- | |
| Buxton-Sinclair April | -- | -- |
Source: Public Records
Mortgage History
| Date | Status | Borrower | Loan Amount |
|---|---|---|---|
| Previous Owner | Buxton-Sinclair April | $432,437 |
Source: Public Records
Tax History Compared to Growth
Tax History
| Year | Tax Paid | Tax Assessment Tax Assessment Total Assessment is a certain percentage of the fair market value that is determined by local assessors to be the total taxable value of land and additions on the property. | Land | Improvement |
|---|---|---|---|---|
| 2025 | $7,388 | $38,275 | $9,202 | $29,073 |
| 2024 | $5,036 | $36,785 | $10,089 | $26,696 |
| 2023 | $7,388 | $36,785 | $9,889 | $26,896 |
| 2022 | $4,771 | $49,080 | $15,420 | $33,660 |
| 2021 | $4,763 | $40,680 | $15,420 | $25,260 |
| 2020 | $6,751 | $43,680 | $15,420 | $28,260 |
| 2019 | $6,413 | $40,080 | $15,420 | $24,660 |
| 2018 | $6,249 | $30,654 | $11,900 | $18,754 |
| 2017 | $6,062 | $29,736 | $13,291 | $16,445 |
| 2016 | $5,632 | $29,736 | $13,291 | $16,445 |
| 2015 | $3,383 | $26,580 | $17,160 | $9,420 |
| 2014 | $3,383 | $25,545 | $14,023 | $11,522 |
Source: Public Records
Map
Nearby Homes
- 112-29 219th St
- 219-47 112th Ave
- 22117 Murdock Ave
- 21531 Murdock Ave
- 21438 112th Rd
- 215-28 112th Ave
- 22324 Murdock Ave
- 214-38 113th Ave
- 21867 110th Ave
- 109-15 221st St
- 21739 114th Rd
- 217-39 114th Rd
- 215-11 112th Ave
- 216-23 111th Ave
- 22343 113th Dr
- 214-10 113th Ave
- 114-36 220th St
- 113-66 Springfield Blvd
- 215-16 111th Ave
- 218-17 109th Ave
- 21931 112th Rd
- 21931 112th Rd
- 21931 112th Rd
- 21919 112th Rd
- 21935 112th Rd
- 21928 112th Ave
- 21924 112th Ave
- 21932 112th Ave
- 21915 112th Rd
- 21939 112th Rd
- 21920 112th Ave
- 21936 112th Ave
- 21916 112th Ave
- 21940 112th Ave
- 21943 112th Rd
- 21926 112th Rd
- 21930 112th Rd
- 21909 112th Rd
- 21922 112th Rd
- 21934 112th Rd