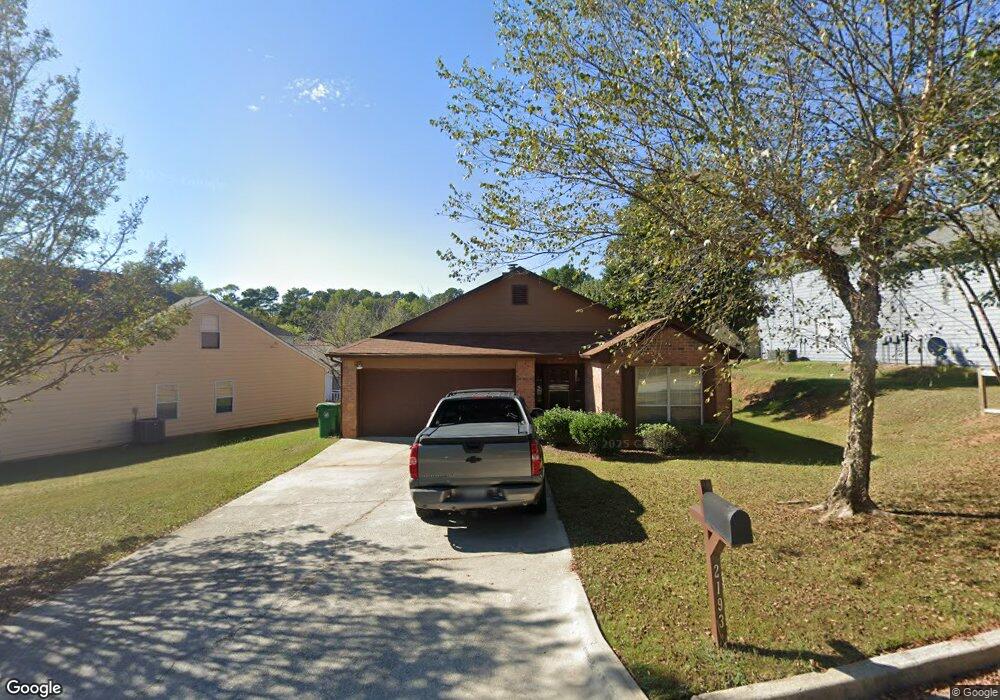
2193 Raven Cir Unit 2 Lithonia, GA 30058
Estimated Value: $244,932 - $277,000
3
Beds
2
Baths
1,612
Sq Ft
$161/Sq Ft
Est. Value
About This Home
This home is located at 2193 Raven Cir Unit 2, Lithonia, GA 30058 and is currently estimated at $259,733, approximately $161 per square foot. 2193 Raven Cir Unit 2 is a home located in DeKalb County with nearby schools including Stoneview Elementary School, Miller Grove Middle School, and Miller Grove High School.
Ownership History
Date
Name
Owned For
Owner Type
Purchase Details
Closed on
Dec 1, 2020
Sold by
Watson Carolyn H
Bought by
Taylor Eric L
Current Estimated Value
Home Financials for this Owner
Home Financials are based on the most recent Mortgage that was taken out on this home.
Original Mortgage
$170,848
Outstanding Balance
$150,793
Interest Rate
2.7%
Mortgage Type
FHA
Estimated Equity
$108,940
Purchase Details
Closed on
Jun 2, 2006
Sold by
Dortch Dottie
Bought by
Watson Carolyn H
Home Financials for this Owner
Home Financials are based on the most recent Mortgage that was taken out on this home.
Original Mortgage
$90,040
Interest Rate
6.5%
Mortgage Type
New Conventional
Purchase Details
Closed on
Mar 1, 2001
Sold by
Woodfolk Kell L
Bought by
Dortch Dollie
Home Financials for this Owner
Home Financials are based on the most recent Mortgage that was taken out on this home.
Original Mortgage
$126,996
Interest Rate
7.12%
Mortgage Type
FHA
Create a Home Valuation Report for This Property
The Home Valuation Report is an in-depth analysis detailing your home's value as well as a comparison with similar homes in the area
Home Values in the Area
Average Home Value in this Area
Purchase History
| Date | Buyer | Sale Price | Title Company |
|---|---|---|---|
| Taylor Eric L | $174,000 | -- | |
| Watson Carolyn H | $112,600 | -- | |
| Dortch Dollie | $128,000 | -- | |
| Dortch Dottie | $128,000 | -- |
Source: Public Records
Mortgage History
| Date | Status | Borrower | Loan Amount |
|---|---|---|---|
| Open | Taylor Eric L | $170,848 | |
| Previous Owner | Watson Carolyn H | $90,040 | |
| Previous Owner | Dortch Dottie | $126,996 | |
| Previous Owner | Dortch Dottie | $22,510 |
Source: Public Records
Tax History Compared to Growth
Tax History
| Year | Tax Paid | Tax Assessment Tax Assessment Total Assessment is a certain percentage of the fair market value that is determined by local assessors to be the total taxable value of land and additions on the property. | Land | Improvement |
|---|---|---|---|---|
| 2025 | $4,866 | $98,240 | $20,000 | $78,240 |
| 2024 | $4,866 | $98,960 | $20,000 | $78,960 |
| 2023 | $4,866 | $96,680 | $16,000 | $80,680 |
| 2022 | $3,909 | $80,680 | $7,200 | $73,480 |
| 2021 | $2,895 | $56,720 | $7,200 | $49,520 |
| 2020 | $2,640 | $51,520 | $7,200 | $44,320 |
| 2019 | $2,558 | $50,000 | $7,200 | $42,800 |
| 2018 | $2,155 | $48,400 | $7,200 | $41,200 |
| 2017 | $2,340 | $42,360 | $3,880 | $38,480 |
| 2016 | $1,691 | $35,360 | $3,880 | $31,480 |
| 2014 | $1,294 | $20,560 | $3,880 | $16,680 |
Source: Public Records
Map
Nearby Homes
- 2396 Hillvale Cir
- 5867 Heritage Walk
- 2863 Hillvale Cove Dr
- 2539 Willow Way Dr
- 5914 Sutcliff Square
- 5918 Sutcliff Square
- 5925 Sutcliff Square
- 2353 Haran Dr Unit 43
- 2360 Haran Dr Unit 34
- 5519 Shirewick Ln
- 2343 Haran Dr Unit 47
- 2343 Haran Dr
- 5806 Keystone Grove
- 2341 Haran Dr Unit 48
- 2341 Haran Dr
- 2339 Haran Dr Unit 49
- 2339 Haran Dr
- 2722 Penwood Place
- 2337 Haran Dr Unit 50
- 2337 Haran Dr
- 2193 Raven Cir Unit 1
- 2205 Raven Cir Unit 1
- 2185 Raven Cir Unit 1
- 2215 Raven Cir
- 5915 Raven Ln Unit 1
- 2225 Raven Cir
- 2190 Raven Cir Unit 1
- 2196 Raven Cir
- 2184 Raven Cir
- 5911 Raven Ln
- 2231 Raven Cir
- 5926 Ravensway Ct Unit 2
- 5920 Raven Ln
- 5927 Ravensway Ct
- 1016 Heritage Walk
- 2237 Raven Cir
- 5903 Raven Ln
- 5932 Ravensway Ct
- 2462 Raven Cir
- 2218 Raven Cir