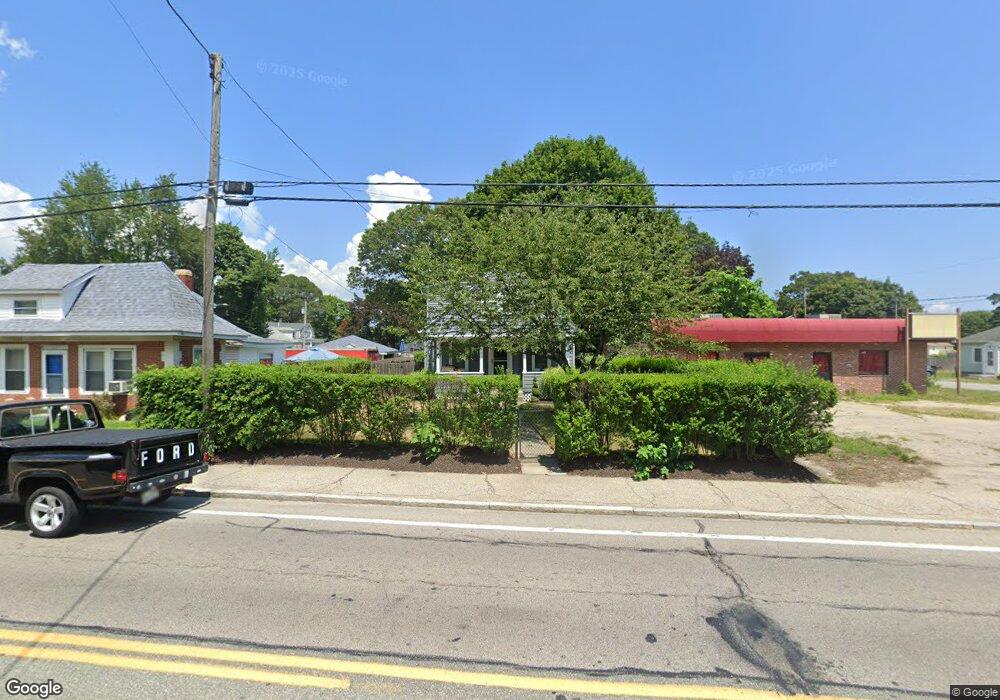
2193 W Shore Rd Warwick, RI 02889
Wildes Corner NeighborhoodEstimated Value: $345,000 - $404,000
3
Beds
2
Baths
1,500
Sq Ft
$251/Sq Ft
Est. Value
About This Home
This home is located at 2193 W Shore Rd, Warwick, RI 02889 and is currently estimated at $375,987, approximately $250 per square foot. 2193 W Shore Rd is a home located in Kent County with nearby schools including Saint Kevin School and Bishop Hendricken High School.
Ownership History
Date
Name
Owned For
Owner Type
Purchase Details
Closed on
Jul 23, 2021
Sold by
Marshall Michael J
Bought by
Lavoie Joshua and Lavoie Susan L
Current Estimated Value
Home Financials for this Owner
Home Financials are based on the most recent Mortgage that was taken out on this home.
Original Mortgage
$166,000
Outstanding Balance
$150,433
Interest Rate
2.96%
Mortgage Type
Purchase Money Mortgage
Estimated Equity
$225,554
Purchase Details
Closed on
Dec 17, 1993
Sold by
Rocchio Judith Ann and Jukes William Lee
Bought by
Marshall Michael J
Home Financials for this Owner
Home Financials are based on the most recent Mortgage that was taken out on this home.
Original Mortgage
$65,250
Interest Rate
7.03%
Mortgage Type
Purchase Money Mortgage
Create a Home Valuation Report for This Property
The Home Valuation Report is an in-depth analysis detailing your home's value as well as a comparison with similar homes in the area
Home Values in the Area
Average Home Value in this Area
Purchase History
| Date | Buyer | Sale Price | Title Company |
|---|---|---|---|
| Lavoie Joshua | $222,000 | None Available | |
| Marshall Michael J | $62,500 | -- |
Source: Public Records
Mortgage History
| Date | Status | Borrower | Loan Amount |
|---|---|---|---|
| Open | Lavoie Joshua | $166,000 | |
| Previous Owner | Marshall Michael J | $85,000 | |
| Previous Owner | Marshall Michael J | $65,250 |
Source: Public Records
Tax History Compared to Growth
Tax History
| Year | Tax Paid | Tax Assessment Tax Assessment Total Assessment is a certain percentage of the fair market value that is determined by local assessors to be the total taxable value of land and additions on the property. | Land | Improvement |
|---|---|---|---|---|
| 2025 | $4,708 | $370,700 | $98,300 | $272,400 |
| 2024 | $4,082 | $282,100 | $83,700 | $198,400 |
| 2023 | $4,003 | $282,100 | $83,700 | $198,400 |
| 2022 | $3,385 | $180,700 | $53,400 | $127,300 |
| 2021 | $3,385 | $180,700 | $53,400 | $127,300 |
| 2020 | $3,385 | $180,700 | $53,400 | $127,300 |
| 2019 | $3,385 | $180,700 | $53,400 | $127,300 |
| 2018 | $2,791 | $137,200 | $49,500 | $87,700 |
| 2017 | $2,777 | $137,200 | $49,500 | $87,700 |
| 2016 | $2,777 | $137,200 | $49,500 | $87,700 |
| 2015 | $2,471 | $119,100 | $46,000 | $73,100 |
| 2014 | $2,389 | $119,100 | $46,000 | $73,100 |
| 2013 | $2,357 | $119,100 | $46,000 | $73,100 |
Source: Public Records
Map
Nearby Homes
- 136 Sefton Ave
- 86 Glen Dr
- 176 Canfield Ave
- 9 Chelmsford Ave
- 191 Canfield Ave
- 31 Oakhurst Ave
- 79 Pinehurst Ave
- 71 Pinehurst Ave
- 34 Pequot Ave
- 75 Northup St
- 71 Northup St
- 80 Northup St
- 206 Reynolds Ave
- 700 Sandy Ln Unit 6
- 700 Sandy Ln Unit 17
- 700 Sandy Ln Unit 18
- 700 Sandy Ln Unit 1
- 117 Second Point Rd
- 209 Wood St
- 183 Shand Ave