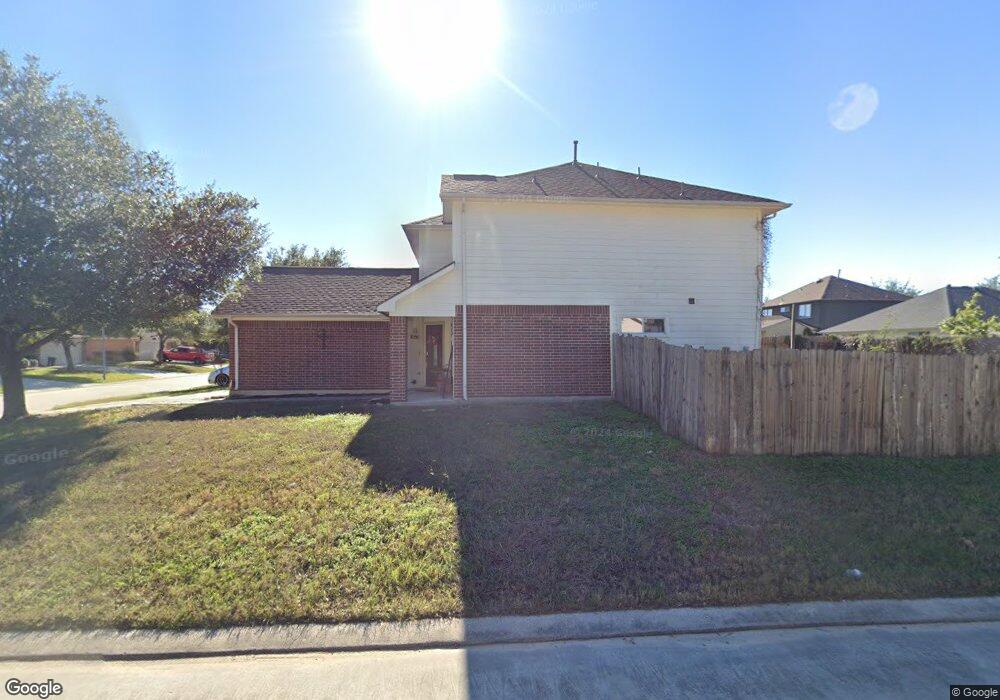
21935 Siberian Elm Ln Houston, TX 77073
Estimated Value: $228,000 - $246,000
4
Beds
3
Baths
1,903
Sq Ft
$124/Sq Ft
Est. Value
About This Home
This home is located at 21935 Siberian Elm Ln, Houston, TX 77073 and is currently estimated at $236,014, approximately $124 per square foot. 21935 Siberian Elm Ln is a home located in Harris County with nearby schools including Ogden Elementary School, Nimitz Ninth Grade School, and Teague Middle School.
Ownership History
Date
Name
Owned For
Owner Type
Purchase Details
Closed on
Oct 4, 2010
Sold by
Us Bank National Association
Bought by
Pena Jessica A
Current Estimated Value
Home Financials for this Owner
Home Financials are based on the most recent Mortgage that was taken out on this home.
Original Mortgage
$89,366
Outstanding Balance
$62,322
Interest Rate
5.5%
Mortgage Type
FHA
Estimated Equity
$173,692
Purchase Details
Closed on
May 4, 2010
Sold by
Howard Chanta
Bought by
Us Bank National Association
Purchase Details
Closed on
Jul 11, 2006
Sold by
Nuhome Of Texas
Bought by
Howard Chanta
Home Financials for this Owner
Home Financials are based on the most recent Mortgage that was taken out on this home.
Original Mortgage
$119,900
Interest Rate
9.5%
Mortgage Type
Purchase Money Mortgage
Create a Home Valuation Report for This Property
The Home Valuation Report is an in-depth analysis detailing your home's value as well as a comparison with similar homes in the area
Home Values in the Area
Average Home Value in this Area
Purchase History
| Date | Buyer | Sale Price | Title Company |
|---|---|---|---|
| Pena Jessica A | -- | Etc | |
| Us Bank National Association | $73,950 | None Available | |
| Howard Chanta | -- | North American Title Co | |
| Lennar Homes Of Texas Sales & Mktg Ltd | -- | North American Title Co |
Source: Public Records
Mortgage History
| Date | Status | Borrower | Loan Amount |
|---|---|---|---|
| Open | Pena Jessica A | $89,366 | |
| Previous Owner | Howard Chanta | $119,900 |
Source: Public Records
Tax History Compared to Growth
Tax History
| Year | Tax Paid | Tax Assessment Tax Assessment Total Assessment is a certain percentage of the fair market value that is determined by local assessors to be the total taxable value of land and additions on the property. | Land | Improvement |
|---|---|---|---|---|
| 2025 | $4,808 | $229,639 | $42,188 | $187,451 |
| 2024 | $4,808 | $245,962 | $42,188 | $203,774 |
| 2023 | $4,808 | $254,174 | $42,188 | $211,986 |
| 2022 | $5,421 | $218,214 | $17,812 | $200,402 |
| 2021 | $5,194 | $176,185 | $18,188 | $157,997 |
| 2020 | $4,904 | $158,738 | $17,812 | $140,926 |
| 2019 | $4,646 | $144,011 | $17,438 | $126,573 |
| 2018 | $1,318 | $144,011 | $18,750 | $125,261 |
| 2017 | $4,319 | $144,011 | $18,750 | $125,261 |
| 2016 | $3,926 | $125,788 | $18,750 | $107,038 |
| 2015 | $3,016 | $119,258 | $18,750 | $100,508 |
| 2014 | $3,016 | $95,581 | $18,750 | $76,831 |
Source: Public Records
Map
Nearby Homes
- 21919 Siberian Elm Ln
- 2827 Cypress Island Dr
- 2639 Cypress Island Dr
- 2934 Cypress Island Dr
- 21819 Yucca Tip Ln
- 3039 Cypress Island Dr
- 3327 Bluebird Park Ln
- 3318 Owl Crossing Ln
- 21526 N Werrington Way
- 21603 Micheala Way
- 3000 Titleist Dr
- 3434 Fiorella Way
- 21406 N Werrington Way
- 2006 Millhouse Rd
- 2126 Millhouse Rd
- 23002 Grand Rapids Ln
- 2531 Anzalone Dr
- 3334 Maris Way
- 1910 Briarcreek Blvd
- 3715 Arbor Trails Dr
- 21931 Siberian Elm Ln
- 21927 Siberian Elm Ln
- 21934 Hemlock Park Dr
- 21923 Siberian Elm Ln
- 21930 Hemlock Park Dr
- 2739 Cypress Island Dr
- 2735 Cypress Island Dr
- 2803 Cypress Island Dr
- 21926 Hemlock Park Dr
- 2731 Cypress Island Dr
- 21934 Siberian Elm Ln
- 21922 Hemlock Park Dr
- 2727 Cypress Island Dr
- 21930 Siberian Elm Ln
- 21926 Siberian Elm Ln
- 2723 Cypress Island Dr
- 21918 Hemlock Park Dr
- 2811 Cypress Island Dr
- 21922 Siberian Elm Ln
- 21915 Siberian Elm Ln