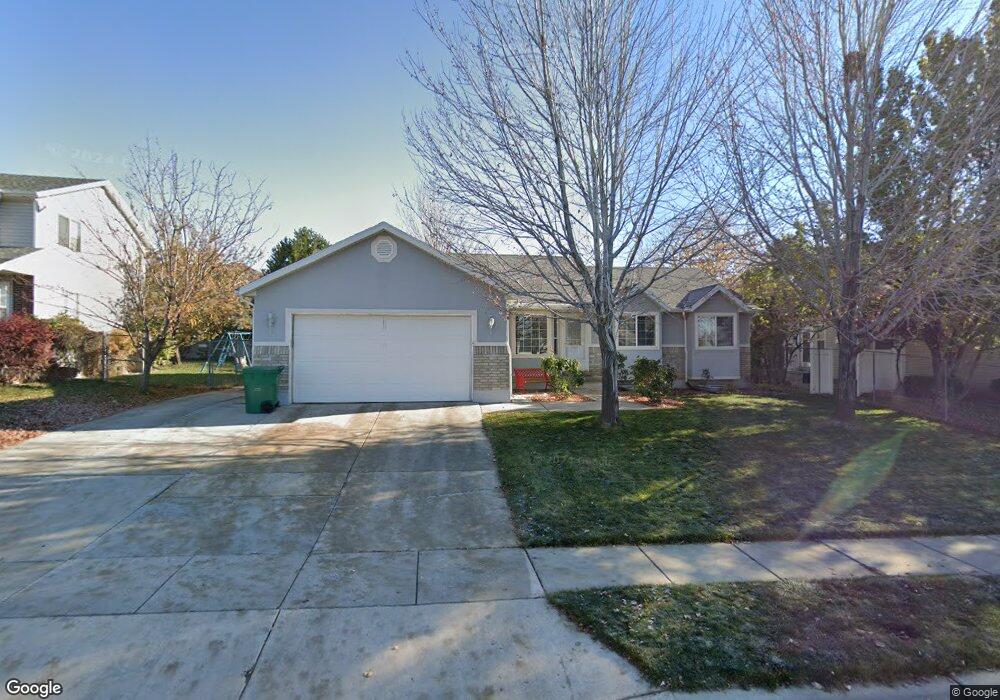
2194 N 800 W Layton, UT 84041
Estimated Value: $513,000 - $569,000
5
Beds
3
Baths
2,834
Sq Ft
$193/Sq Ft
Est. Value
About This Home
This home is located at 2194 N 800 W, Layton, UT 84041 and is currently estimated at $547,906, approximately $193 per square foot. 2194 N 800 W is a home located in Davis County with nearby schools including Lincoln Elementary School, North Layton Junior High School, and Northridge High School.
Ownership History
Date
Name
Owned For
Owner Type
Purchase Details
Closed on
Jan 13, 2021
Sold by
Bravo Ariel
Bought by
Bravo Ariel F and Nunez Paola Andrea
Current Estimated Value
Home Financials for this Owner
Home Financials are based on the most recent Mortgage that was taken out on this home.
Original Mortgage
$201,000
Outstanding Balance
$178,982
Interest Rate
2.71%
Mortgage Type
New Conventional
Estimated Equity
$368,924
Purchase Details
Closed on
May 15, 2020
Sold by
Bravo Ariel
Bought by
Bravo Ariel F and Nunez Andrea Tosar
Home Financials for this Owner
Home Financials are based on the most recent Mortgage that was taken out on this home.
Original Mortgage
$201,000
Interest Rate
3.3%
Mortgage Type
New Conventional
Purchase Details
Closed on
May 6, 1998
Sold by
Sli Commercial Real Estate Co
Bought by
Johnson Robert D and Johnson Charon Rose
Home Financials for this Owner
Home Financials are based on the most recent Mortgage that was taken out on this home.
Original Mortgage
$135,700
Interest Rate
7.05%
Create a Home Valuation Report for This Property
The Home Valuation Report is an in-depth analysis detailing your home's value as well as a comparison with similar homes in the area
Home Values in the Area
Average Home Value in this Area
Purchase History
| Date | Buyer | Sale Price | Title Company |
|---|---|---|---|
| Bravo Ariel F | -- | Inwest Title Services | |
| Bravo Ariel | -- | Inwest Title Services | |
| Bravo Ariel F | -- | Inwest Title Services | |
| Bravo Ariel | -- | Inwest Title Services | |
| Johnson Robert D | -- | Security Title |
Source: Public Records
Mortgage History
| Date | Status | Borrower | Loan Amount |
|---|---|---|---|
| Open | Bravo Ariel | $201,000 | |
| Closed | Bravo Ariel | $201,000 | |
| Closed | Johnson Robert D | $135,700 |
Source: Public Records
Tax History
| Year | Tax Paid | Tax Assessment Tax Assessment Total Assessment is a certain percentage of the fair market value that is determined by local assessors to be the total taxable value of land and additions on the property. | Land | Improvement |
|---|---|---|---|---|
| 2025 | $2,578 | $270,600 | $99,967 | $170,633 |
| 2024 | $2,460 | $260,150 | $116,604 | $143,546 |
| 2023 | $2,468 | $460,000 | $139,759 | $320,241 |
| 2022 | $2,587 | $261,800 | $73,554 | $188,246 |
| 2021 | $2,385 | $360,000 | $102,285 | $257,715 |
| 2020 | $2,175 | $315,000 | $86,440 | $228,560 |
| 2019 | $2,108 | $299,000 | $82,440 | $216,560 |
| 2018 | $1,910 | $272,000 | $82,440 | $189,560 |
| 2016 | $1,811 | $133,045 | $26,096 | $106,949 |
| 2015 | $1,764 | $122,980 | $26,096 | $96,884 |
| 2014 | $1,772 | $126,338 | $26,096 | $100,242 |
| 2013 | -- | $119,731 | $26,884 | $92,847 |
Source: Public Records
Map
Nearby Homes
- 2149 N 750 W
- 820 W 2350 N
- 2386 N 800 W
- 579 W 2350 N
- 2186 N 525 W
- 2236 N 525 W
- 2298 N 1085 W
- 506 W 2200 N
- 498 W 2200 N
- 2320 N 1085 W
- 2246 N 475 W
- 1012 W 2525 N
- 2234 N 450 W
- 2214 N 450 W
- 621 Paul Ave
- 1094 N Angel St W
- 2875 N Hill Field Rd Unit 17
- 2875 N Hill Field Rd Unit 199
- 2875 N Hill Field Rd Unit 29
- 1420 W 1750 N
Your Personal Tour Guide
Ask me questions while you tour the home.