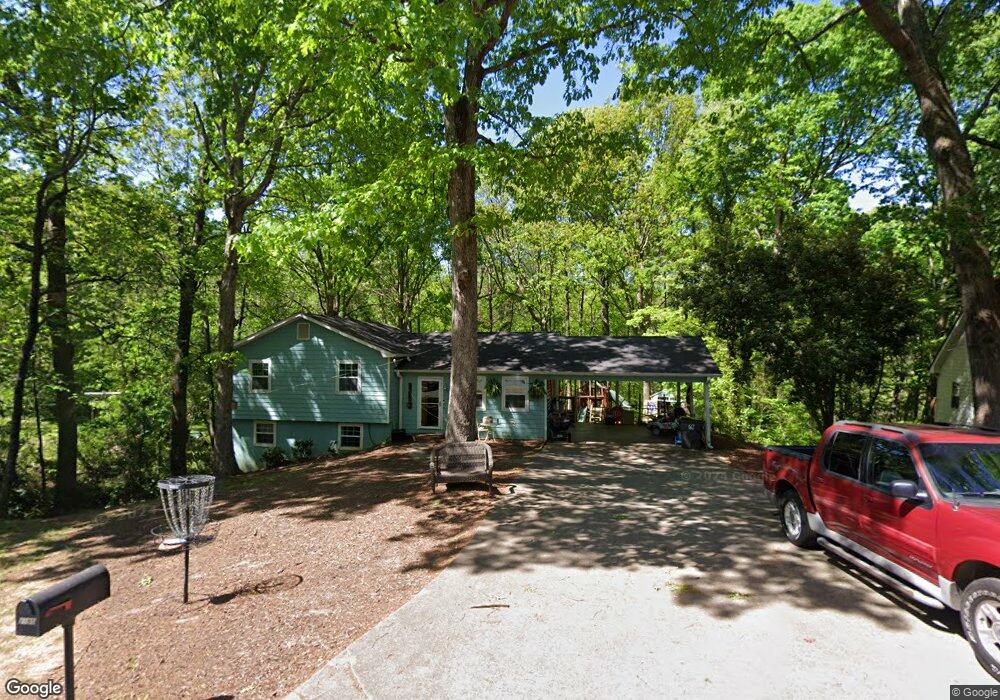
2195 Post Oak Dr Unit 2 Duluth, GA 30097
Estimated Value: $355,000 - $384,000
3
Beds
2
Baths
1,152
Sq Ft
$325/Sq Ft
Est. Value
About This Home
This home is located at 2195 Post Oak Dr Unit 2, Duluth, GA 30097 and is currently estimated at $374,494, approximately $325 per square foot. 2195 Post Oak Dr Unit 2 is a home located in Gwinnett County with nearby schools including M. H. Mason Elementary School, Hull Middle School, and Peachtree Ridge High School.
Ownership History
Date
Name
Owned For
Owner Type
Purchase Details
Closed on
Aug 7, 2018
Sold by
Sansbury James Chester
Bought by
Mackenzie Laura and Mackenzie Daniel Mackenzie
Current Estimated Value
Home Financials for this Owner
Home Financials are based on the most recent Mortgage that was taken out on this home.
Original Mortgage
$205,000
Outstanding Balance
$177,291
Interest Rate
4.5%
Mortgage Type
New Conventional
Estimated Equity
$197,203
Purchase Details
Closed on
Jul 20, 2017
Sold by
Rohrbacher William Jacob
Bought by
Sansbury James Chester and Sansbury Heather Irene
Purchase Details
Closed on
Apr 15, 1999
Sold by
Findley Murlene T
Bought by
Rohrbacher William J
Home Financials for this Owner
Home Financials are based on the most recent Mortgage that was taken out on this home.
Original Mortgage
$97,950
Interest Rate
7.06%
Mortgage Type
FHA
Create a Home Valuation Report for This Property
The Home Valuation Report is an in-depth analysis detailing your home's value as well as a comparison with similar homes in the area
Home Values in the Area
Average Home Value in this Area
Purchase History
| Date | Buyer | Sale Price | Title Company |
|---|---|---|---|
| Mackenzie Laura | $220,000 | -- | |
| Sansbury James Chester | $75,000 | -- | |
| Rohrbacher William J | $98,000 | -- |
Source: Public Records
Mortgage History
| Date | Status | Borrower | Loan Amount |
|---|---|---|---|
| Open | Mackenzie Laura | $205,000 | |
| Previous Owner | Rohrbacher William J | $97,950 |
Source: Public Records
Map
Nearby Homes
- 3742 Terrah Point Dr
- 3742 Terrah Point Dr Unit 43
- 2572 Carnot Ct
- 3476 Flycatchers Way
- 3476 Flycatcher Way
- 2382 Harpers Way
- 2107 Hailston Dr
- 2281 Bransley Place
- 3614 Clearbrooke Way
- 2017 Parsons Ridge Cir
- 3920 Glenview Club Ln
- 3899 Glenview Club Ln
- 2016 Parsons Ridge Cir
- 2177 Parkside Glen View
- 3855 Lake Burton Dr
- 2207 Parkside Glen View
- 2008 Hailston Dr
- 2005 Hailston Dr
- 2345 Hiawassee Dr
- 3334 Swallowtail Terrace
- 2185 Post Oak Dr
- 2205 Post Oak Dr
- 2175 Post Oak Dr Unit 2
- 2194 Post Oak Dr
- 2204 Post Oak Dr
- 2215 Post Oak Dr
- 2174 Post Oak Dr
- 2214 Post Oak Dr Unit 2
- 3689 Union Park Dr
- 3689 Union Park Dr Unit 54
- 3689 Union Park Dr
- 2225 Post Oak Dr
- 3709 Union Park Dr
- 2224 Post Oak Dr
- 3719 Union Park Dr
- 3729 Union Park Dr Unit 57
- 3729 Union Park Dr
- 2319 Post Cove
- 3679 Union Park Dr
- 3749 Union Park Dr Unit 59
Your Personal Tour Guide
Ask me questions while you tour the home.