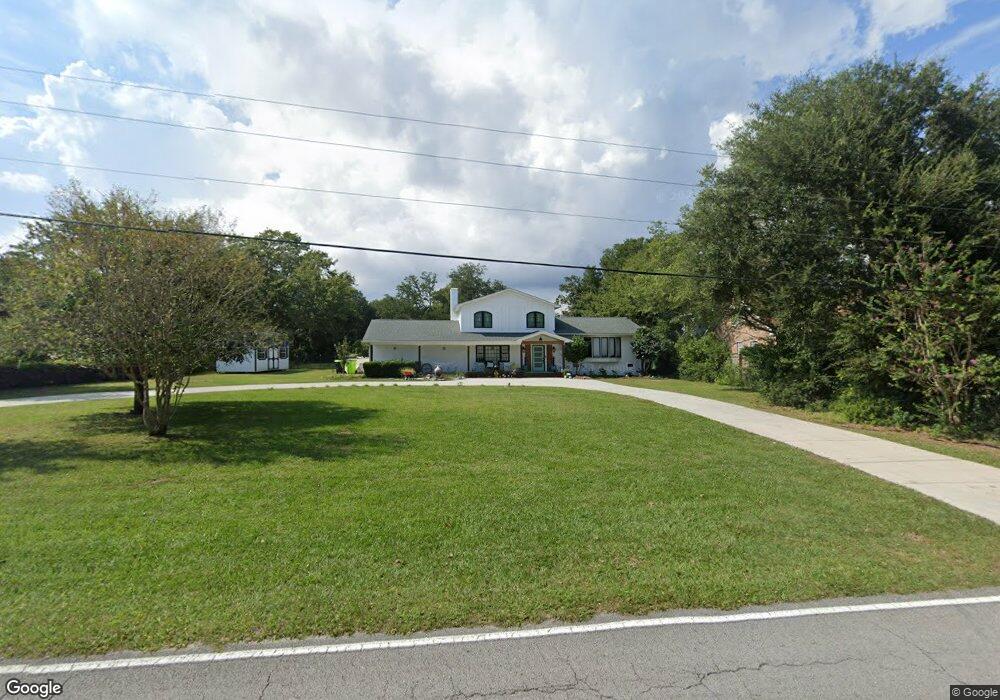
2195 Scotts Hill Loop Rd Wilmington, NC 28411
Estimated Value: $403,000 - $514,000
4
Beds
3
Baths
1,730
Sq Ft
$266/Sq Ft
Est. Value
About This Home
This home is located at 2195 Scotts Hill Loop Rd, Wilmington, NC 28411 and is currently estimated at $459,508, approximately $265 per square foot. 2195 Scotts Hill Loop Rd is a home located in Pender County with nearby schools including South Topsail Elementary School, Topsail Middle School, and Topsail High School.
Ownership History
Date
Name
Owned For
Owner Type
Purchase Details
Closed on
Apr 13, 2017
Sold by
Smith Virginia Clark
Bought by
Martins Lucas and Martins Stephanie Paige
Current Estimated Value
Home Financials for this Owner
Home Financials are based on the most recent Mortgage that was taken out on this home.
Original Mortgage
$155,000
Interest Rate
4.21%
Mortgage Type
Purchase Money Mortgage
Purchase Details
Closed on
Oct 28, 2016
Sold by
Smith Virginia Clark
Bought by
Smith Virginia Clark and Margaret Minton Clark Trust
Purchase Details
Closed on
Dec 5, 2013
Sold by
Clark Margaret Minton
Bought by
Smith Virginia Clark and Clark Family Irrevocable Asset Protectio
Purchase Details
Closed on
Jan 26, 2005
Sold by
Clark Margaret Minton
Bought by
Clark Margaret Minton and The Margaret Minton Clark Trust
Create a Home Valuation Report for This Property
The Home Valuation Report is an in-depth analysis detailing your home's value as well as a comparison with similar homes in the area
Home Values in the Area
Average Home Value in this Area
Purchase History
| Date | Buyer | Sale Price | Title Company |
|---|---|---|---|
| Martins Lucas | $156,000 | None Available | |
| Smith Virginia Clark | -- | None Available | |
| Smith Virginia Clark | -- | None Available | |
| Clark Margaret Minton | -- | -- |
Source: Public Records
Mortgage History
| Date | Status | Borrower | Loan Amount |
|---|---|---|---|
| Closed | Martins Lucas | $155,000 |
Source: Public Records
Tax History Compared to Growth
Tax History
| Year | Tax Paid | Tax Assessment Tax Assessment Total Assessment is a certain percentage of the fair market value that is determined by local assessors to be the total taxable value of land and additions on the property. | Land | Improvement |
|---|---|---|---|---|
| 2024 | $1,834 | $176,655 | $116,863 | $59,792 |
| 2023 | $1,815 | $145,739 | $116,863 | $28,876 |
| 2022 | $1,323 | $145,739 | $116,863 | $28,876 |
| 2021 | $1,323 | $145,739 | $116,863 | $28,876 |
| 2020 | $1,323 | $145,739 | $116,863 | $28,876 |
| 2019 | $1,323 | $145,739 | $116,863 | $28,876 |
| 2018 | $2,104 | $131,079 | $100,000 | $31,079 |
| 2017 | $2,104 | $228,527 | $100,000 | $128,527 |
| 2016 | $2,081 | $228,527 | $100,000 | $128,527 |
| 2015 | $2,063 | $228,527 | $100,000 | $128,527 |
| 2014 | $1,616 | $228,527 | $100,000 | $128,527 |
| 2013 | -- | $228,527 | $100,000 | $128,527 |
| 2012 | -- | $228,527 | $100,000 | $128,527 |
Source: Public Records
Map
Nearby Homes
- 112 Francis Marion Dr
- 348 Lafayette St
- 8707 Lowes Island Dr
- 216 La Salle St
- 102 La Salle St
- 424 Black Diamond Dr
- 111 Marshfield Dr
- 8702 Thornblade Cir
- 8404 Fazio Dr
- 8335 Vintage Club Cir
- 415 Sugar Cove Unit Lot 44
- 571 Windstar Ln
- 1279 Pandion Dr
- 528 Beach Rd N
- 704 Heart Pne Ave Unit Lot 52
- 335 Heart Pine Ave Unit Lot 99
- 623 Heart Pine Ave
- 0 Heart Pine Ave Unit 100543376
- 23 Comber Rd
- 10 Bowen Ct Unit Lot 53
- 103 Poplar Grove Rd
- 105 Poplar Grove Rd
- 120 Poplar Grove Rd
- 118 Poplar Grove Rd
- 124 Poplar Grove Rd
- 2200 Scotts Hill Loop Rd
- 107 Poplar Grove Rd
- 2234 Scotts Hill Loop Rd
- 109 Abbey Ln
- 2255 Scotts Hill Loop Rd
- 2188 Scotts Hill Loop Rd
- 109 Poplar Grove Rd
- 111 Poplar Grove Rd
- 2170 Scotts Hill Loop Rd
- 113 Poplar Grove Rd
- 115 Poplar Grove Rd
- 117 Poplar Grove Rd
- 119 Poplar Grove Rd
- 121 Poplar Grove Rd
- 123 Poplar Grove Rd