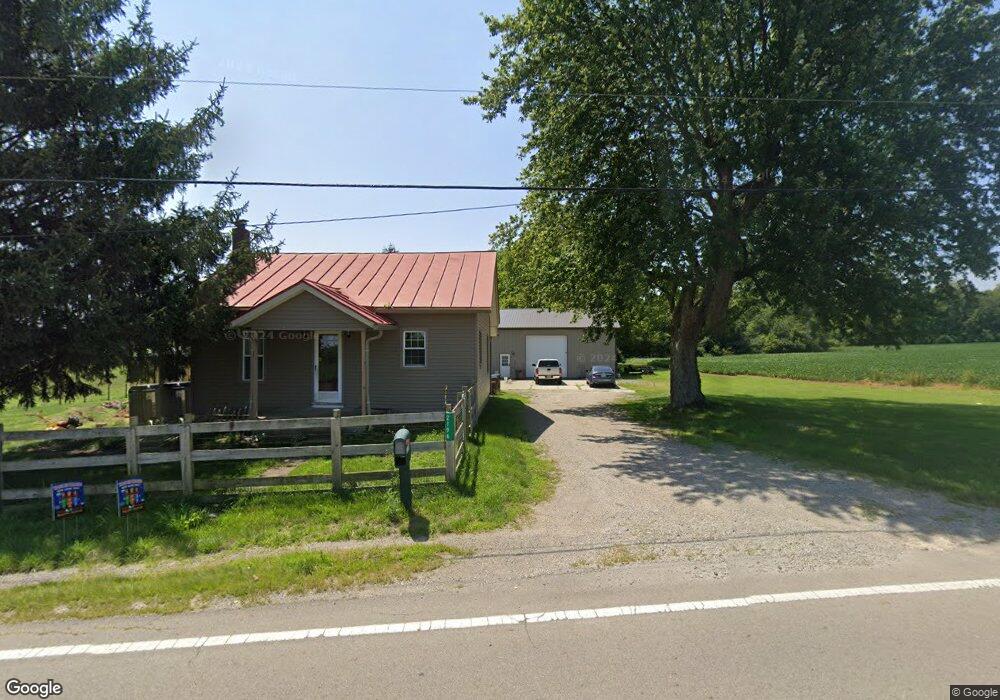
2196 State Route 725 E Camden, OH 45311
Estimated Value: $206,926 - $279,000
2
Beds
1
Bath
988
Sq Ft
$234/Sq Ft
Est. Value
About This Home
This home is located at 2196 State Route 725 E, Camden, OH 45311 and is currently estimated at $230,732, approximately $233 per square foot. 2196 State Route 725 E is a home located in Preble County with nearby schools including Preble Shawnee Elementary School, West Elkton Intermediate School, and Preble Shawnee Junior/Senior High School.
Ownership History
Date
Name
Owned For
Owner Type
Purchase Details
Closed on
Nov 9, 2023
Sold by
Farling Eric L
Bought by
Farling Christine L
Current Estimated Value
Purchase Details
Closed on
Jul 30, 2013
Sold by
Via Ralph E and Via Theresa J
Bought by
Farling Eric L and Farling Christine L
Home Financials for this Owner
Home Financials are based on the most recent Mortgage that was taken out on this home.
Original Mortgage
$128,000
Interest Rate
4.49%
Mortgage Type
VA
Purchase Details
Closed on
May 20, 1992
Bought by
Farling Eric L and Farling Christine L
Purchase Details
Closed on
Dec 2, 1986
Bought by
Farling Eric L and Farling Christine L
Create a Home Valuation Report for This Property
The Home Valuation Report is an in-depth analysis detailing your home's value as well as a comparison with similar homes in the area
Home Values in the Area
Average Home Value in this Area
Purchase History
| Date | Buyer | Sale Price | Title Company |
|---|---|---|---|
| Farling Christine L | -- | None Listed On Document | |
| Farling Eric L | $126,000 | None Available | |
| Farling Eric L | $27,000 | -- | |
| Farling Eric L | $49,800 | -- |
Source: Public Records
Mortgage History
| Date | Status | Borrower | Loan Amount |
|---|---|---|---|
| Previous Owner | Farling Eric L | $128,000 |
Source: Public Records
Tax History Compared to Growth
Tax History
| Year | Tax Paid | Tax Assessment Tax Assessment Total Assessment is a certain percentage of the fair market value that is determined by local assessors to be the total taxable value of land and additions on the property. | Land | Improvement |
|---|---|---|---|---|
| 2024 | $2,080 | $56,040 | $15,470 | $40,570 |
| 2023 | $2,080 | $56,040 | $15,470 | $40,570 |
| 2022 | $1,755 | $44,980 | $14,740 | $30,240 |
| 2021 | $1,832 | $44,980 | $14,740 | $30,240 |
| 2020 | $1,314 | $33,120 | $14,740 | $18,380 |
| 2019 | $1,133 | $27,830 | $12,180 | $15,650 |
| 2018 | $1,171 | $27,830 | $12,180 | $15,650 |
| 2017 | $1,071 | $27,830 | $12,180 | $15,650 |
| 2016 | $1,041 | $26,810 | $11,830 | $14,980 |
| 2014 | $570 | $26,810 | $11,830 | $14,980 |
| 2013 | $570 | $26,810 | $11,830 | $14,980 |
Source: Public Records
Map
Nearby Homes
- 725 Sr
- 759 Barnetts Mill Rd
- 471 Camden West Elkton Rd
- 103 Katherine Ct
- 131 S Lafayette St
- 388 W Hendricks St
- 407 W Central Ave
- 6171 Somers Gratis Rd
- 679 Oxford Germantown Rd
- 817 Old Norse Dr
- 820 Lars Cove
- 805 Brande Dr
- 787 Baltic Dr
- 314 Lakengren Dr
- 0 Lars Cove Unit 1745954
- 1222 Oxford Germantown Rd
- 1246 Oxford Germantown Rd
- 105 Mill St
- 3412 Ohio 122
- 12320 Ohio 122
- 2196 E St Rt 725
- 2298 State Route 725 E
- 2307 State Route 725 E
- 1974 State Route 725 E
- 2517 State Route 725 E
- 2523 Somers Gratis Rd
- 1615 State Route 725 E
- 1616 State Route 725 E
- 1616 State Route 725 E
- 1615 E St Rt 725
- 1456 State Route 725 E
- 1456 State Route 725 E
- 2382 Somers Gratis Rd
- 1456 E 725 E S R
- 1456 Ohio 725
- 1456 E 725 State
- 2099 Somers Gratis Rd
- 1446 State Route 725 E Unit A
- 3 Acres Somers Gratis Rd
- 3.222ac Somers Gratis Rd