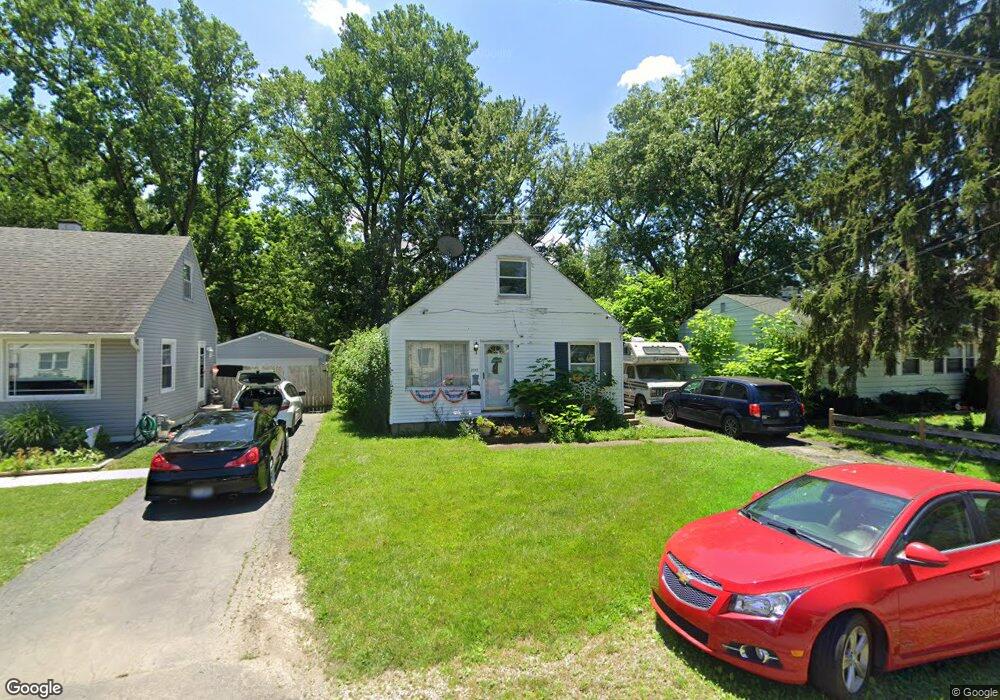
2197 Lehner Rd Columbus, OH 43224
North Linden NeighborhoodEstimated Value: $91,167 - $254,000
3
Beds
1
Bath
979
Sq Ft
$160/Sq Ft
Est. Value
About This Home
This home is located at 2197 Lehner Rd, Columbus, OH 43224 and is currently estimated at $157,042, approximately $160 per square foot. 2197 Lehner Rd is a home located in Franklin County with nearby schools including North Linden Elementary School, Medina Middle School, and Mifflin High School.
Ownership History
Date
Name
Owned For
Owner Type
Purchase Details
Closed on
Sep 19, 2025
Sold by
Chang Jui-Wan Norah
Bought by
Santos Realty Llc
Current Estimated Value
Purchase Details
Closed on
Aug 20, 2004
Sold by
Simon Mary E
Bought by
Chang Jui Wan
Home Financials for this Owner
Home Financials are based on the most recent Mortgage that was taken out on this home.
Original Mortgage
$65,975
Interest Rate
6.1%
Mortgage Type
FHA
Purchase Details
Closed on
Jun 9, 1987
Bought by
Simon Mary E
Create a Home Valuation Report for This Property
The Home Valuation Report is an in-depth analysis detailing your home's value as well as a comparison with similar homes in the area
Home Values in the Area
Average Home Value in this Area
Purchase History
| Date | Buyer | Sale Price | Title Company |
|---|---|---|---|
| Santos Realty Llc | $92,500 | Empora Title | |
| Chang Jui Wan | $69,900 | -- | |
| Simon Mary E | -- | -- |
Source: Public Records
Mortgage History
| Date | Status | Borrower | Loan Amount |
|---|---|---|---|
| Previous Owner | Chang Jui Wan | $65,975 |
Source: Public Records
Tax History
| Year | Tax Paid | Tax Assessment Tax Assessment Total Assessment is a certain percentage of the fair market value that is determined by local assessors to be the total taxable value of land and additions on the property. | Land | Improvement |
|---|---|---|---|---|
| 2025 | $2,521 | $42,810 | $8,820 | $33,990 |
| 2024 | $2,521 | $42,810 | $8,820 | $33,990 |
| 2023 | $2,495 | $42,810 | $8,820 | $33,990 |
| 2022 | $1,602 | $21,530 | $5,390 | $16,140 |
| 2021 | $1,605 | $21,530 | $5,390 | $16,140 |
| 2020 | $1,607 | $21,530 | $5,390 | $16,140 |
| 2019 | $1,387 | $17,160 | $4,310 | $12,850 |
| 2018 | $1,454 | $17,160 | $4,310 | $12,850 |
| 2017 | $1,558 | $17,160 | $4,310 | $12,850 |
| 2016 | $1,730 | $18,800 | $3,500 | $15,300 |
| 2015 | $1,521 | $18,800 | $3,500 | $15,300 |
| 2014 | $1,474 | $18,800 | $3,500 | $15,300 |
| 2013 | $853 | $20,860 | $3,885 | $16,975 |
Source: Public Records
Map
Nearby Homes
- 2283 Ward Rd
- 2100 Ferris Rd
- 2267 Ferris Rd
- 2299 Belcher Dr
- 2023 Ferris Rd
- 2045 Sale Rd
- 4090 Cleveland Ave
- 1997 Ferris Rd
- 1946 Lehner Rd
- 2081 Ormond Ave
- 4309 Walford St
- 1874 Sale Rd
- 1863 Ward Rd
- 2529 Ferris Park Dr S
- 2583 Milverton Way
- 2010 Melrose Ave
- 1734 Ferris Rd
- 2594 Adda Ave
- 3750 Dresden St
- 1637 Sale Rd
Your Personal Tour Guide
Ask me questions while you tour the home.