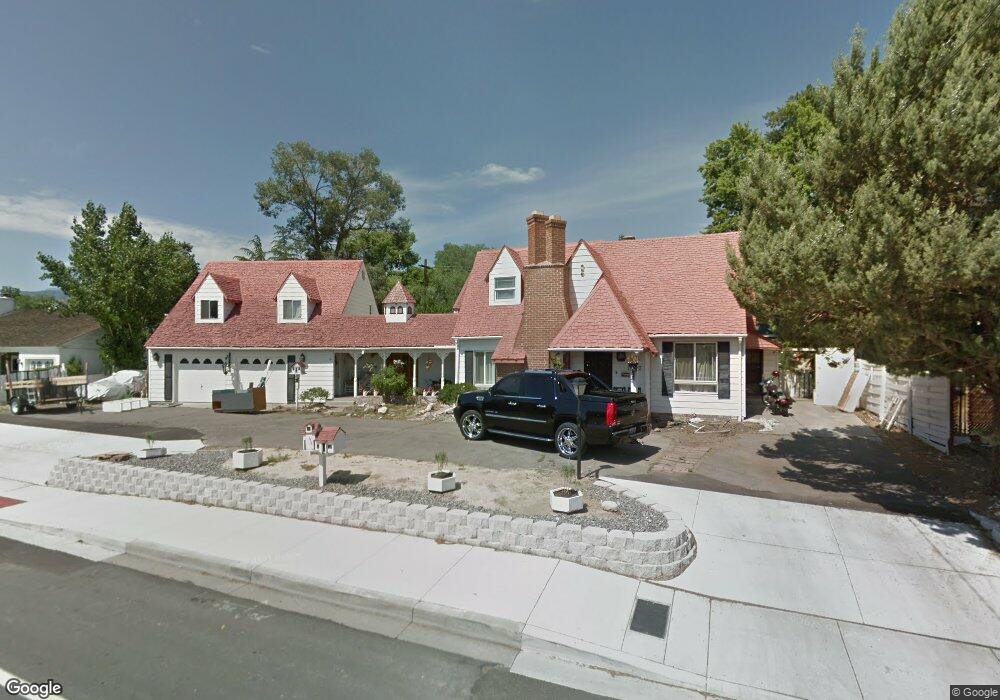
2197 Plumas St Unit 2 Reno, NV 89509
Virginia Lake NeighborhoodEstimated Value: $950,489 - $1,186,000
6
Beds
3
Baths
3,715
Sq Ft
$292/Sq Ft
Est. Value
About This Home
This home is located at 2197 Plumas St Unit 2, Reno, NV 89509 and is currently estimated at $1,084,372, approximately $291 per square foot. 2197 Plumas St Unit 2 is a home located in Washoe County with nearby schools including Jessie Beck Elementary School, Darrell C Swope Middle School, and Reno High School.
Ownership History
Date
Name
Owned For
Owner Type
Purchase Details
Closed on
Feb 11, 2005
Sold by
Exum Wade
Bought by
Exum Wade and Exum Carolyn Jan
Current Estimated Value
Home Financials for this Owner
Home Financials are based on the most recent Mortgage that was taken out on this home.
Original Mortgage
$450,000
Outstanding Balance
$217,359
Interest Rate
5%
Mortgage Type
Unknown
Estimated Equity
$867,013
Purchase Details
Closed on
Jun 17, 2002
Sold by
Exum Jan
Bought by
Exum Wade
Home Financials for this Owner
Home Financials are based on the most recent Mortgage that was taken out on this home.
Original Mortgage
$300,000
Interest Rate
9.65%
Purchase Details
Closed on
Jun 12, 2002
Sold by
Williamson Carolee P and Smith Darlyne
Bought by
Exum Wade
Home Financials for this Owner
Home Financials are based on the most recent Mortgage that was taken out on this home.
Original Mortgage
$300,000
Interest Rate
9.65%
Create a Home Valuation Report for This Property
The Home Valuation Report is an in-depth analysis detailing your home's value as well as a comparison with similar homes in the area
Home Values in the Area
Average Home Value in this Area
Purchase History
| Date | Buyer | Sale Price | Title Company |
|---|---|---|---|
| Exum Wade | -- | Transcontinental Title Co | |
| Exum Wade | $375,000 | Stewart Title Northern Nevad | |
| Exum Wade | $375,000 | Stewart Title Northern Nevad |
Source: Public Records
Mortgage History
| Date | Status | Borrower | Loan Amount |
|---|---|---|---|
| Open | Exum Wade | $450,000 | |
| Closed | Exum Wade | $300,000 |
Source: Public Records
Tax History Compared to Growth
Tax History
| Year | Tax Paid | Tax Assessment Tax Assessment Total Assessment is a certain percentage of the fair market value that is determined by local assessors to be the total taxable value of land and additions on the property. | Land | Improvement |
|---|---|---|---|---|
| 2025 | $2,623 | $138,573 | $64,883 | $73,690 |
| 2024 | $2,623 | $135,680 | $62,388 | $73,292 |
| 2023 | $2,554 | $124,482 | $56,873 | $67,609 |
| 2022 | $2,476 | $103,291 | $48,381 | $54,910 |
| 2021 | $2,403 | $96,051 | $42,263 | $53,788 |
| 2020 | $2,106 | $89,644 | $42,263 | $47,381 |
| 2019 | $2,044 | $81,749 | $36,575 | $45,174 |
| 2018 | $1,982 | $78,133 | $34,650 | $43,483 |
| 2017 | $1,926 | $69,580 | $28,000 | $41,580 |
| 2016 | $1,877 | $68,174 | $26,250 | $41,924 |
| 2015 | $1,874 | $59,703 | $18,060 | $41,643 |
| 2014 | $1,819 | $53,073 | $13,335 | $39,738 |
| 2013 | -- | $48,075 | $9,450 | $38,625 |
Source: Public Records
Map
Nearby Homes
- 330 Sunset Dr
- 395 Hillcrest Dr
- 395 Chevy Chase St
- 2330 Sunrise Dr
- 421 Glenmanor Dr
- 2750 Plumas St Unit 123
- 2750 Plumas St Unit 201
- 2750 Plumas St Unit 109
- 230 Glenmanor Dr
- 2700 Plumas St Unit 108
- 2700 Plumas St Unit 112
- 2700 Plumas St Unit 211
- 2700 Plumas St Unit 300
- 1633 Knox Ave
- 820 Rosewood Dr
- 2180 Alamo Square Way
- 2040 Alamo Square Way
- 2020 Alamo Square Way
- 1000 Beck St Unit 160
- 1000 Beck St Unit 361E
- 2197 Plumas St
- 2203 Plumas St
- 2165 Plumas St
- 2184 Humboldt St
- 205 Urban Rd
- 2190 Plumas St
- 209 Urban Rd
- 2180 Humboldt St
- 2133 Plumas St
- 2170 Humboldt St
- 393 Morningside Dr
- 2150 Plumas St
- 390 Morningside Dr
- 2200 Plumas St
- 2160 Humboldt St
- 2099 Plumas St
- 2100 Plumas St
- 2150 Humboldt St
- 385 Morningside Dr
- 0 Sunset Dr Unit 150008429