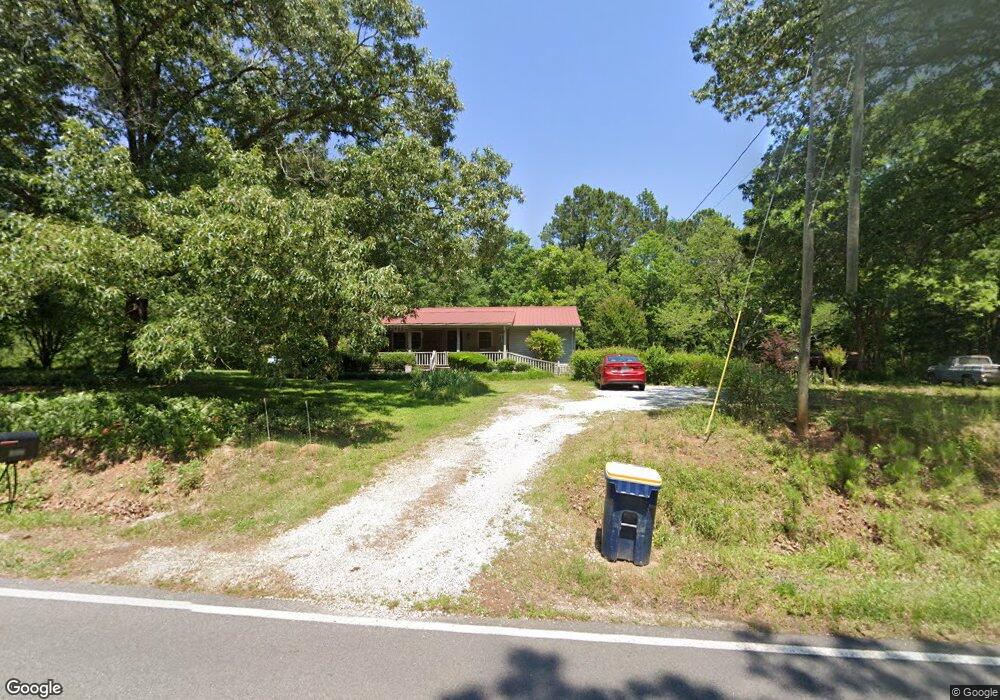
2198 Bobby Brown State Park Rd Elberton, GA 30635
Estimated Value: $196,187 - $269,000
3
Beds
1
Bath
1,325
Sq Ft
$169/Sq Ft
Est. Value
About This Home
This home is located at 2198 Bobby Brown State Park Rd, Elberton, GA 30635 and is currently estimated at $224,047, approximately $169 per square foot. 2198 Bobby Brown State Park Rd is a home located in Elbert County with nearby schools including Elbert County Primary School, Elbert County Elementary School, and Elbert County Middle School.
Ownership History
Date
Name
Owned For
Owner Type
Purchase Details
Closed on
Jun 13, 2016
Sold by
Sullivan Larry L
Bought by
Turman Clifford Greg and Turman Natasha Irene
Current Estimated Value
Home Financials for this Owner
Home Financials are based on the most recent Mortgage that was taken out on this home.
Original Mortgage
$89,351
Outstanding Balance
$71,528
Interest Rate
3.75%
Mortgage Type
FHA
Estimated Equity
$152,519
Purchase Details
Closed on
Apr 3, 2013
Sold by
Burleson John Steven
Bought by
Sullivan Larry L and Sullivan Particia L
Purchase Details
Closed on
Apr 8, 2011
Sold by
Pless Fred Lee
Bought by
Burleson John Steven
Home Financials for this Owner
Home Financials are based on the most recent Mortgage that was taken out on this home.
Original Mortgage
$75,525
Interest Rate
4.85%
Purchase Details
Closed on
Apr 1, 1991
Purchase Details
Closed on
Feb 1, 1990
Purchase Details
Closed on
Jun 1, 1973
Purchase Details
Closed on
Sep 1, 1971
Create a Home Valuation Report for This Property
The Home Valuation Report is an in-depth analysis detailing your home's value as well as a comparison with similar homes in the area
Home Values in the Area
Average Home Value in this Area
Purchase History
| Date | Buyer | Sale Price | Title Company |
|---|---|---|---|
| Turman Clifford Greg | $91,000 | -- | |
| Sullivan Larry L | $65,000 | -- | |
| Burleson John Steven | $79,500 | -- | |
| -- | -- | -- | |
| -- | -- | -- | |
| -- | $1,000 | -- | |
| -- | -- | -- |
Source: Public Records
Mortgage History
| Date | Status | Borrower | Loan Amount |
|---|---|---|---|
| Open | Turman Clifford Greg | $89,351 | |
| Previous Owner | Burleson John Steven | $75,525 |
Source: Public Records
Tax History Compared to Growth
Tax History
| Year | Tax Paid | Tax Assessment Tax Assessment Total Assessment is a certain percentage of the fair market value that is determined by local assessors to be the total taxable value of land and additions on the property. | Land | Improvement |
|---|---|---|---|---|
| 2024 | $1,218 | $52,815 | $6,577 | $46,238 |
| 2023 | $1,218 | $52,815 | $6,577 | $46,238 |
| 2022 | $877 | $38,596 | $3,915 | $34,681 |
| 2021 | $879 | $38,596 | $3,915 | $34,681 |
| 2020 | $770 | $30,315 | $3,918 | $26,397 |
| 2019 | $800 | $30,315 | $3,918 | $26,397 |
| 2018 | $824 | $30,315 | $3,918 | $26,397 |
| 2017 | $758 | $26,141 | $3,918 | $22,223 |
| 2016 | $767 | $26,141 | $3,918 | $22,223 |
| 2015 | -- | $26,141 | $3,918 | $22,223 |
| 2014 | -- | $26,141 | $3,918 | $22,223 |
| 2013 | -- | $26,141 | $3,918 | $22,223 |
Source: Public Records
Map
Nearby Homes
- 2150 Bobby Brown St Pk Rd
- 2150 Bobby Brown State Park Rd
- 1968 Bobby Brown State Park Rd
- 2786 Chapel Dr
- 2852 Bramlett Dr
- Lot 75 Bramlett Cir
- 1485 Broad River Scenic Dr
- LOT 74 Bramlett Dr
- 0 Cade Cir Unit 10610520
- 2734 Windward Harbor Dr
- 0 Windward Harbor Dr Unit 7659681
- 0 Windward Harbor Dr Unit 10616804
- 8171 Elberton Hwy
- 0 Cooter Creek Unit LotWP001 22764301
- 3706 Cooter Creek Rd
- 0 Lbk Rd Unit 10614136
- 0 Lbk Rd Unit 545965
- Lot 14b Lbk Cir
- 2164 Lincolnton Hwy
- 1876 Bobby Brown State Park Rd
- 2198 Bobby Brown St Park Rd
- 2191 Bobby Brown State Park Rd
- 2164 Bobby Brown State Park Rd
- 2227 Bobby Brown State Park Rd
- 2169 Bobby Brown State Park Rd
- 2164 Bobby Brown State Park
- 2223 Bobby Brown State Park Rd
- 2198 Bobby Brown Rd
- 2151 Bobby Brown State Park Rd
- 2255 Bobby Brown State Park Rd
- 2132 Bobby Brown State Park Rd
- 4212 Modock Landing Dr
- 2255 Bobby Brown St Park Rd
- 2254 Bobby Brown State Park Rd
- 2134 Bobby Brown State Park Rd
- 4211 Modock Landing Dr
- 2167 Bobby Brown State Park Rd
- 2129 Bobby Brown State Park Rd
- 2129 Bobby Brown State Park Rd
- 0 Modoc Landing Rd