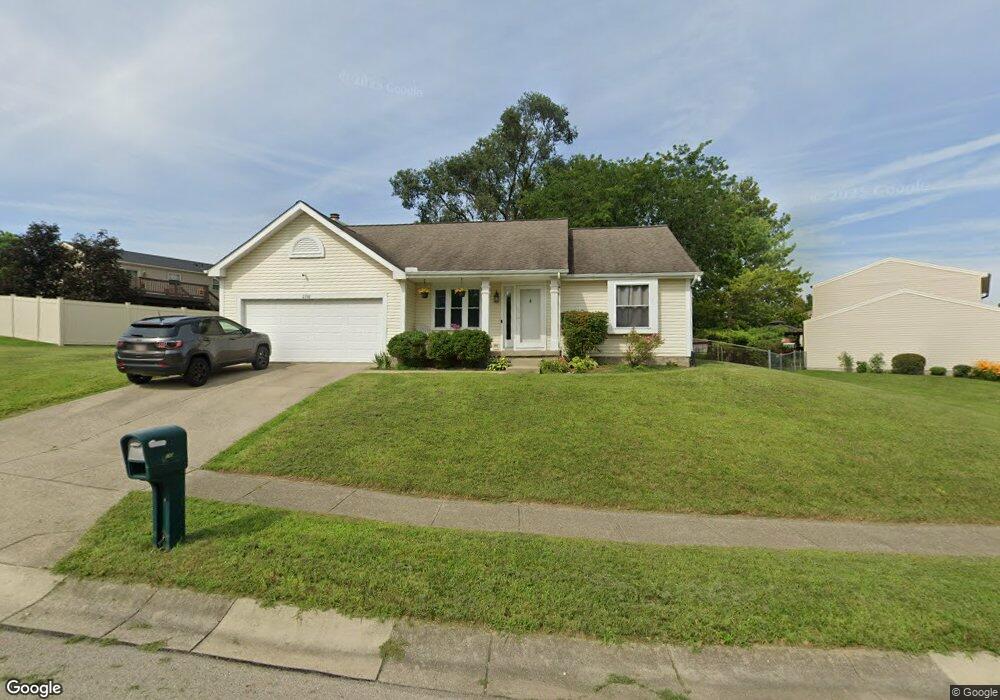
2198 Painter Place Miamisburg, OH 45342
Estimated Value: $248,000 - $272,000
3
Beds
2
Baths
1,356
Sq Ft
$192/Sq Ft
Est. Value
About This Home
This home is located at 2198 Painter Place, Miamisburg, OH 45342 and is currently estimated at $259,989, approximately $191 per square foot. 2198 Painter Place is a home located in Montgomery County with nearby schools including Miamisburg High School and Bethel Baptist School.
Ownership History
Date
Name
Owned For
Owner Type
Purchase Details
Closed on
Sep 26, 2016
Sold by
Thompson Michael A and Thompson Jessica R
Bought by
Killen Michael
Current Estimated Value
Home Financials for this Owner
Home Financials are based on the most recent Mortgage that was taken out on this home.
Original Mortgage
$137,464
Interest Rate
3.5%
Mortgage Type
FHA
Purchase Details
Closed on
Jan 29, 2014
Sold by
Thompson Michael A and Thompson Jessica R
Bought by
Thompson Michael A and Thompson Jessica R
Purchase Details
Closed on
Feb 1, 2008
Sold by
Turner Amy M and Turner Jeff
Bought by
Thompson Michael A and Thompson Jessica R
Purchase Details
Closed on
Apr 20, 1998
Sold by
Sharp William R and Sharp Robin L
Bought by
Landen Amy M
Home Financials for this Owner
Home Financials are based on the most recent Mortgage that was taken out on this home.
Original Mortgage
$93,150
Interest Rate
7.27%
Purchase Details
Closed on
Nov 10, 1994
Sold by
Pierce Carrie D
Bought by
Sharp William R and Sharp Robin L
Create a Home Valuation Report for This Property
The Home Valuation Report is an in-depth analysis detailing your home's value as well as a comparison with similar homes in the area
Home Values in the Area
Average Home Value in this Area
Purchase History
| Date | Buyer | Sale Price | Title Company |
|---|---|---|---|
| Killen Michael | $140,000 | Terratitle Llc | |
| Thompson Michael A | -- | None Available | |
| Thompson Michael A | $145,400 | Attorney | |
| Landen Amy M | $103,500 | -- | |
| Landen Amy M | $103,500 | -- | |
| Sharp William R | -- | Midwest Abstract Co |
Source: Public Records
Mortgage History
| Date | Status | Borrower | Loan Amount |
|---|---|---|---|
| Previous Owner | Killen Michael | $137,464 | |
| Previous Owner | Landen Amy M | $93,150 |
Source: Public Records
Tax History Compared to Growth
Tax History
| Year | Tax Paid | Tax Assessment Tax Assessment Total Assessment is a certain percentage of the fair market value that is determined by local assessors to be the total taxable value of land and additions on the property. | Land | Improvement |
|---|---|---|---|---|
| 2024 | $3,884 | $58,860 | $13,020 | $45,840 |
| 2023 | $3,884 | $58,860 | $13,020 | $45,840 |
| 2022 | $3,729 | $47,460 | $10,500 | $36,960 |
| 2021 | $3,316 | $47,460 | $10,500 | $36,960 |
| 2020 | $3,311 | $47,460 | $10,500 | $36,960 |
| 2019 | $2,959 | $40,790 | $8,750 | $32,040 |
| 2018 | $2,969 | $40,790 | $8,750 | $32,040 |
| 2017 | $2,948 | $40,790 | $8,750 | $32,040 |
| 2016 | $2,813 | $36,480 | $8,750 | $27,730 |
| 2015 | $2,684 | $36,480 | $8,750 | $27,730 |
| 2014 | $2,684 | $36,480 | $8,750 | $27,730 |
| 2012 | -- | $42,290 | $11,200 | $31,090 |
Source: Public Records
Map
Nearby Homes
- 628 Jamestown Dr
- 712 Decker Dr
- 736 Decker Dr
- 2141 Rosina Dr
- 2279 Rosina Dr
- 1157 Bonniebrook Dr
- 2127 Carrington Ln
- 1826 Ashley Dr
- 615 Burnside Dr
- 1808 Burnside Dr
- 766 Dunaway St
- 1131 Castleton Ct
- 807 Dunaway St
- 1786 Ashley Dr
- 902 Althea Dr
- 302 Trails Way Unit 27unb
- 1734 Rosina Dr
- 1907 Falling Leaf Ln Unit 35801TH
- 1902 Whispering Tree Dr Unit B
- 1901 Whispering Tree Dr Unit 34701
- 2194 Painter Place
- 2195 Belvo Rd
- 2193 Belvo Rd
- 2190 Painter Place
- 2199 Painter Place
- 2195 Painter Place
- 2201 Belvo Rd
- 2191 Belvo Rd
- 2186 Painter Place
- 2214 Belvo Rd
- 2189 Belvo Rd
- 4138 Belvo Rd
- 2182 Painter Place
- 2202 Belvo Rd
- 2183 Painter Place
- 2193 Painter Place
- 2178 Painter Place
- 612 Jamestown Dr
- 2191 Painter Place
- 2179 Painter Place