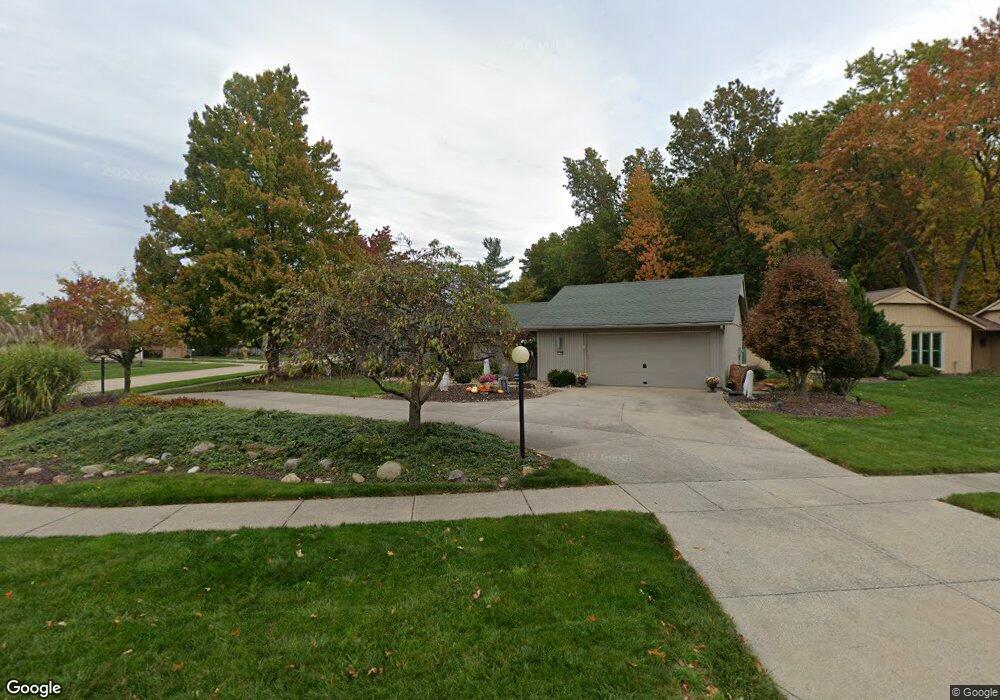
21982 Little Brook Way Strongsville, OH 44149
Estimated Value: $329,000 - $386,000
3
Beds
3
Baths
1,988
Sq Ft
$177/Sq Ft
Est. Value
About This Home
This home is located at 21982 Little Brook Way, Strongsville, OH 44149 and is currently estimated at $352,016, approximately $177 per square foot. 21982 Little Brook Way is a home located in Cuyahoga County with nearby schools including Strongsville High School and Sts Joseph & John Interparochial School.
Ownership History
Date
Name
Owned For
Owner Type
Purchase Details
Closed on
Oct 30, 2015
Sold by
Carpenter Richard B and Carpenter Renee M
Bought by
Harn Jacqueline L
Current Estimated Value
Home Financials for this Owner
Home Financials are based on the most recent Mortgage that was taken out on this home.
Original Mortgage
$155,200
Outstanding Balance
$122,568
Interest Rate
3.91%
Mortgage Type
New Conventional
Estimated Equity
$229,448
Purchase Details
Closed on
Jul 10, 2008
Sold by
Lunte Sandra W
Bought by
Carpenter Richard B and Carpenter Renee M
Home Financials for this Owner
Home Financials are based on the most recent Mortgage that was taken out on this home.
Original Mortgage
$47,000
Interest Rate
5.7%
Mortgage Type
Purchase Money Mortgage
Purchase Details
Closed on
Jun 24, 1987
Bought by
Lunte Willard M and Lunte Sandra W
Purchase Details
Closed on
Jan 1, 1980
Bought by
Bob Schmitt Homes Inc
Create a Home Valuation Report for This Property
The Home Valuation Report is an in-depth analysis detailing your home's value as well as a comparison with similar homes in the area
Home Values in the Area
Average Home Value in this Area
Purchase History
| Date | Buyer | Sale Price | Title Company |
|---|---|---|---|
| Harn Jacqueline L | $160,000 | Ohio Real Title | |
| Carpenter Richard B | $197,000 | Attorney | |
| Lunte Willard M | $122,000 | -- | |
| Bob Schmitt Homes Inc | -- | -- |
Source: Public Records
Mortgage History
| Date | Status | Borrower | Loan Amount |
|---|---|---|---|
| Open | Harn Jacqueline L | $155,200 | |
| Previous Owner | Carpenter Richard B | $47,000 |
Source: Public Records
Tax History Compared to Growth
Tax History
| Year | Tax Paid | Tax Assessment Tax Assessment Total Assessment is a certain percentage of the fair market value that is determined by local assessors to be the total taxable value of land and additions on the property. | Land | Improvement |
|---|---|---|---|---|
| 2024 | $4,519 | $96,250 | $21,315 | $74,935 |
| 2023 | $5,074 | $81,030 | $23,560 | $57,470 |
| 2022 | $5,037 | $81,030 | $23,560 | $57,470 |
| 2021 | $4,997 | $81,030 | $23,560 | $57,470 |
| 2020 | $4,631 | $66,430 | $19,320 | $47,110 |
| 2019 | $4,495 | $189,800 | $55,200 | $134,600 |
| 2018 | $3,666 | $66,430 | $19,320 | $47,110 |
| 2017 | $3,761 | $56,700 | $15,330 | $41,370 |
| 2016 | $3,731 | $56,700 | $15,330 | $41,370 |
| 2015 | $4,111 | $63,460 | $15,330 | $48,130 |
| 2014 | $4,111 | $61,610 | $14,880 | $46,730 |
Source: Public Records
Map
Nearby Homes
- 0 Priem Rd
- 10353 Oak Branch Trail
- 11030 Southwind Ct
- 10842 Fence Row Dr
- 22300 Rock Creek Cir
- 10008 Plum Brook Ln
- 10824 Watercress Rd
- 9829 Plum Brook Ln
- 21359 Briar Bush Ln
- 21292 Creekside Dr
- 10800 Meadow Trail
- 10839 Prospect Rd
- 9598 Pebble Brook Ln
- 21469 Woodview Cir
- 20684 Albion Rd
- 8746 Barton Dr
- 12515 Countryside Dr
- 8902 Lincolnshire Blvd
- 9384 N Marks Rd
- 12579 Woodberry Ln
- 21946 Little Brook Way
- 21910 Little Brook Way
- 10656 Shale Brook Way
- 10712 Shale Brook Way
- 10539 Shale Brook Way
- 10600 Shale Brook Way
- 21981 Little Brook Way
- 21945 Little Brook Way
- 21874 Little Brook Way
- 22017 Little Brook Way
- 10768 Shale Brook Way
- 10544 Shale Brook Way
- 10483 Shale Brook Way
- 22053 Little Brook Way
- 21909 Little Brook Way
- 10762 Oak Branch Trail
- 10488 Shale Brook Way
- 21838 Little Brook Way
- 10759 Oak Branch Trail
- 10427 Shale Brook Way