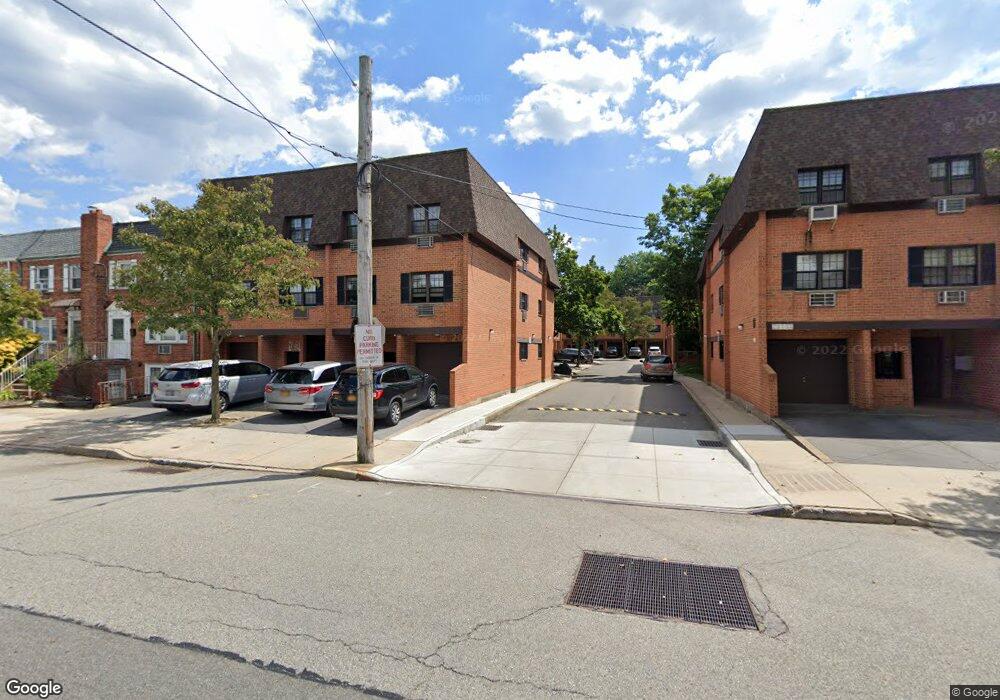
21986 64th Ave Unit 347 Oakland Gardens, NY 11364
Oakland Gardens NeighborhoodEstimated Value: $718,000 - $757,000
--
Bed
--
Bath
1,058
Sq Ft
$698/Sq Ft
Est. Value
About This Home
This home is located at 21986 64th Ave Unit 347, Oakland Gardens, NY 11364 and is currently estimated at $738,538, approximately $698 per square foot. 21986 64th Ave Unit 347 is a home located in Queens County with nearby schools including P.S. 46 - Alley Pond, Nathaniel Hawthorne Middle School 74, and Benjamin N Cardozo High School.
Ownership History
Date
Name
Owned For
Owner Type
Purchase Details
Closed on
Aug 28, 2025
Sold by
Ji Chang Il and Ji Min A
Bought by
Li Yiqi
Current Estimated Value
Purchase Details
Closed on
May 11, 2006
Sold by
Park Choon Ja and Park Ui Ho
Bought by
Ji Chang Il and Ji Min A
Home Financials for this Owner
Home Financials are based on the most recent Mortgage that was taken out on this home.
Original Mortgage
$376,000
Interest Rate
6.53%
Mortgage Type
Purchase Money Mortgage
Purchase Details
Closed on
Nov 22, 2002
Sold by
Lee Chun Sook
Bought by
Park Choon Ja and Park Ui Ho
Purchase Details
Closed on
Sep 18, 2000
Sold by
Chai Yeong Mun and Chai Soon Hee
Bought by
Lee Chun Sook
Home Financials for this Owner
Home Financials are based on the most recent Mortgage that was taken out on this home.
Original Mortgage
$213,300
Interest Rate
7.89%
Mortgage Type
Purchase Money Mortgage
Create a Home Valuation Report for This Property
The Home Valuation Report is an in-depth analysis detailing your home's value as well as a comparison with similar homes in the area
Home Values in the Area
Average Home Value in this Area
Purchase History
| Date | Buyer | Sale Price | Title Company |
|---|---|---|---|
| Li Yiqi | $765,000 | -- | |
| Ji Chang Il | $470,000 | -- | |
| Ji Chang Il | $470,000 | -- | |
| Park Choon Ja | $340,000 | -- | |
| Park Choon Ja | $340,000 | -- | |
| Lee Chun Sook | $237,000 | Chicago Title Insurance Co | |
| Lee Chun Sook | $237,000 | Chicago Title Insurance Co |
Source: Public Records
Mortgage History
| Date | Status | Borrower | Loan Amount |
|---|---|---|---|
| Previous Owner | Ji Chang Il | $376,000 | |
| Previous Owner | Lee Chun Sook | $213,300 | |
| Closed | Park Choon Ja | $0 |
Source: Public Records
Tax History Compared to Growth
Tax History
| Year | Tax Paid | Tax Assessment Tax Assessment Total Assessment is a certain percentage of the fair market value that is determined by local assessors to be the total taxable value of land and additions on the property. | Land | Improvement |
|---|---|---|---|---|
| 2025 | $4,469 | $23,831 | $1,317 | $22,514 |
| 2024 | $4,750 | $23,648 | $1,310 | $22,338 |
| 2023 | $4,200 | $22,310 | $1,183 | $21,127 |
| 2022 | $3,915 | $40,773 | $2,319 | $38,454 |
| 2021 | $3,883 | $38,793 | $2,319 | $36,474 |
| 2020 | $3,908 | $34,411 | $2,319 | $32,092 |
| 2019 | $3,830 | $29,855 | $464 | $29,391 |
| 2018 | $3,492 | $18,592 | $303 | $18,289 |
| 2017 | $3,276 | $17,541 | $292 | $17,249 |
| 2016 | $2,998 | $17,541 | $292 | $17,249 |
| 2015 | $1,776 | $16,549 | $288 | $16,261 |
| 2014 | $1,776 | $16,423 | $306 | $16,117 |
Source: Public Records
Map
Nearby Homes
- 21934 64th Ave Unit 337
- 219-38 64th Ave
- 21970 64th Ave Unit 245
- 64-15 Springfield Blvd Unit A
- 217-18 64th Ave
- 64-14 218th St
- 64-35 Springfield Blvd Unit A
- 220-31 67th Ave Unit 2B
- 220-75 67th Ave Unit 139
- 64-41 Springfield Blvd Unit B
- 58-44 219th St
- 220- 34 67th Ave Unit Duplex
- 6418 217th St
- 221-03 67th Ave Unit 1
- 221-03 67th Ave Unit A
- 216-03 64th Ave
- 6411 Bell Blvd
- 6748 Springfield Blvd Unit 1 FL
- 64-64 Bell Blvd
- 21608 67th Ave Unit DUPLEX
- 21986 64th Ave Unit 1 A
- 21986 64th Ave
- 21986 64th Ave Unit 345
- 21986 64th Ave
- 21986 64th Ave Unit Lower
- 21986 64th Ave
- 21986 64th Ave Unit 348
- 21986 64th Ave Unit 346
- 21984 64th Ave
- 21984 64th Ave
- 21984 64th Ave
- 21984 64th Ave Unit 350
- 21984 64th Ave Unit 352
- 21984 64th Ave Unit 349
- 21984 64th Ave Unit 351
- 21984 64th Ave Unit B
- 219-84 64th Ave Unit B
- 21982 64th Ave
- 21982 64th Ave
- 21982 64th Ave Unit 355