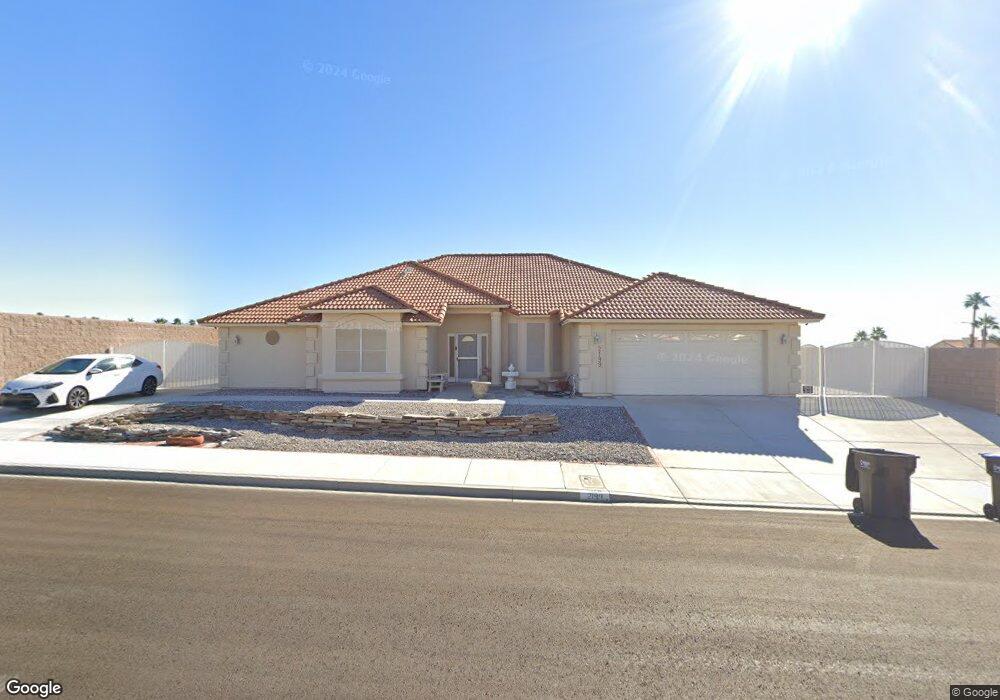
2199 Bayview Loop Dr Laughlin, NV 89029
Estimated Value: $453,522 - $588,000
4
Beds
3
Baths
2,494
Sq Ft
$204/Sq Ft
Est. Value
About This Home
This home is located at 2199 Bayview Loop Dr, Laughlin, NV 89029 and is currently estimated at $507,631, approximately $203 per square foot. 2199 Bayview Loop Dr is a home located in Clark County with nearby schools including William G. Bennett Elementary School and Laughlin Junior/Senior High School.
Ownership History
Date
Name
Owned For
Owner Type
Purchase Details
Closed on
Sep 15, 2023
Sold by
Pollard Deborah S
Bought by
Deborah Pollard Trust and Pollard
Current Estimated Value
Purchase Details
Closed on
Mar 24, 2000
Sold by
South Pointe Industries
Bought by
Pollard Thomas S and Pollard Deborah S
Create a Home Valuation Report for This Property
The Home Valuation Report is an in-depth analysis detailing your home's value as well as a comparison with similar homes in the area
Purchase History
| Date | Buyer | Sale Price | Title Company |
|---|---|---|---|
| Deborah Pollard Trust | -- | None Listed On Document | |
| Pollard Thomas S | $54,000 | United Title |
Source: Public Records
Tax History
| Year | Tax Paid | Tax Assessment Tax Assessment Total Assessment is a certain percentage of the fair market value that is determined by local assessors to be the total taxable value of land and additions on the property. | Land | Improvement |
|---|---|---|---|---|
| 2026 | $4,273 | $163,119 | $22,418 | $140,701 |
| 2025 | $4,149 | $165,124 | $22,050 | $143,074 |
| 2024 | $4,029 | $165,124 | $22,050 | $143,074 |
| 2023 | $4,029 | $167,699 | $33,075 | $134,624 |
| 2022 | $3,911 | $146,494 | $23,520 | $122,974 |
| 2021 | $3,797 | $140,371 | $23,520 | $116,851 |
| 2020 | $3,685 | $139,048 | $23,520 | $115,528 |
| 2019 | $3,577 | $135,544 | $21,683 | $113,861 |
| 2018 | $3,473 | $129,847 | $20,213 | $109,634 |
| 2017 | $4,390 | $131,120 | $18,743 | $112,377 |
| 2016 | $3,287 | $120,396 | $13,598 | $106,798 |
| 2015 | $3,280 | $122,305 | $14,700 | $107,605 |
| 2014 | $3,185 | $101,273 | $14,700 | $86,573 |
Source: Public Records
Map
Nearby Homes
- 3640 Catalina Dr
- 3614 Bayview Dr
- 3637 Cottage Stream Ct
- 3698 Laughlin Blvd
- 3624 Bayview Dr
- 3634 Bayview Dr
- 3644 Bayview Dr
- 3651 S Pointe Cir
- 3597 Cottage Wood St
- 2063 W Avalon Dr
- 3647 S Pointe Cir
- 3740 Desert Marina Dr Unit 2
- 3740 Desert Marina Dr Unit 12
- 3730 Desert Marina Dr Unit 16
- 3730 Desert Marina Dr Unit 17
- 3720 Desert Marina Dr Unit 33
- 3720 Desert Marina Dr Unit 29
- 3720 Desert Marina Dr Unit 32
- 3771 Desert Marina Dr Unit 95
- 3599 Cottage Canyon St
- 2195 Bayview Loop Dr
- 3641 Brian Ct
- 3650 Catalina Dr
- 2203 Bayview Loop Dr
- 3651 Brian Ct
- 2191 Bayview Loop Dr
- 2191 Bayview Loop Dr
- 3660 Catalina Dr
- 3631 Brian Ct
- 3639 Catalina Dr
- 3639 Catalina Dr
- 3649 Catalina Dr
- 3661 Brian Ct
- 3629 Catalina Dr
- 3659 Catalina Dr
- 3670 Catalina Dr
- 3642 Brian Ct
- 2181 Bayview Loop Dr
- 3669 Catalina Dr
- 3648 Laughlin Blvd
Your Personal Tour Guide
Ask me questions while you tour the home.