21B Kingery Quarter Unit 107 Willowbrook, IL 60527
Waterfall Glen NeighborhoodEstimated Value: $193,000 - $203,307
3
Beds
2
Baths
1,224
Sq Ft
$163/Sq Ft
Est. Value
About This Home
This home is located at 21B Kingery Quarter Unit 107, Willowbrook, IL 60527 and is currently estimated at $199,577, approximately $163 per square foot. 21B Kingery Quarter Unit 107 is a home located in DuPage County with nearby schools including Anne M. Jeans Elementary School, Burr Ridge Middle School, and Hinsdale South High School.
Ownership History
Date
Name
Owned For
Owner Type
Purchase Details
Closed on
Dec 22, 2006
Sold by
Oskova Petia H
Bought by
Yetgen Ali J
Current Estimated Value
Home Financials for this Owner
Home Financials are based on the most recent Mortgage that was taken out on this home.
Original Mortgage
$152,000
Outstanding Balance
$108,962
Interest Rate
10.27%
Mortgage Type
Purchase Money Mortgage
Estimated Equity
$90,615
Purchase Details
Closed on
Jun 4, 2003
Sold by
Oskov Dimitar R and Oskova Petia H
Bought by
Oskova Petia H
Home Financials for this Owner
Home Financials are based on the most recent Mortgage that was taken out on this home.
Original Mortgage
$65,000
Interest Rate
4.25%
Mortgage Type
Purchase Money Mortgage
Purchase Details
Closed on
Jun 25, 1999
Sold by
Son Chaim
Bought by
Oskov Dimitar A and Oskov Petia H
Home Financials for this Owner
Home Financials are based on the most recent Mortgage that was taken out on this home.
Original Mortgage
$67,378
Interest Rate
7.43%
Mortgage Type
FHA
Create a Home Valuation Report for This Property
The Home Valuation Report is an in-depth analysis detailing your home's value as well as a comparison with similar homes in the area
Home Values in the Area
Average Home Value in this Area
Purchase History
| Date | Buyer | Sale Price | Title Company |
|---|---|---|---|
| Yetgen Ali J | $160,000 | C T I C Dupage | |
| Oskova Petia H | -- | Git | |
| Oskov Dimitar A | $69,000 | -- |
Source: Public Records
Mortgage History
| Date | Status | Borrower | Loan Amount |
|---|---|---|---|
| Open | Yetgen Ali J | $152,000 | |
| Previous Owner | Oskova Petia H | $65,000 | |
| Previous Owner | Oskov Dimitar A | $67,378 | |
| Closed | Oskova Petia H | $49,300 |
Source: Public Records
Tax History Compared to Growth
Tax History
| Year | Tax Paid | Tax Assessment Tax Assessment Total Assessment is a certain percentage of the fair market value that is determined by local assessors to be the total taxable value of land and additions on the property. | Land | Improvement |
|---|---|---|---|---|
| 2024 | $2,295 | $48,310 | $11,890 | $36,420 |
| 2023 | $2,177 | $44,410 | $10,930 | $33,480 |
| 2022 | $1,755 | $36,070 | $8,880 | $27,190 |
| 2021 | $1,679 | $35,660 | $8,780 | $26,880 |
| 2020 | $1,648 | $34,960 | $8,610 | $26,350 |
| 2019 | $1,572 | $33,540 | $8,260 | $25,280 |
| 2018 | $1,144 | $26,830 | $6,610 | $20,220 |
| 2017 | $1,123 | $25,820 | $6,360 | $19,460 |
| 2016 | $942 | $22,220 | $6,070 | $16,150 |
| 2015 | $914 | $20,900 | $5,710 | $15,190 |
| 2014 | $893 | $20,320 | $5,550 | $14,770 |
| 2013 | $1,205 | $25,910 | $7,070 | $18,840 |
Source: Public Records
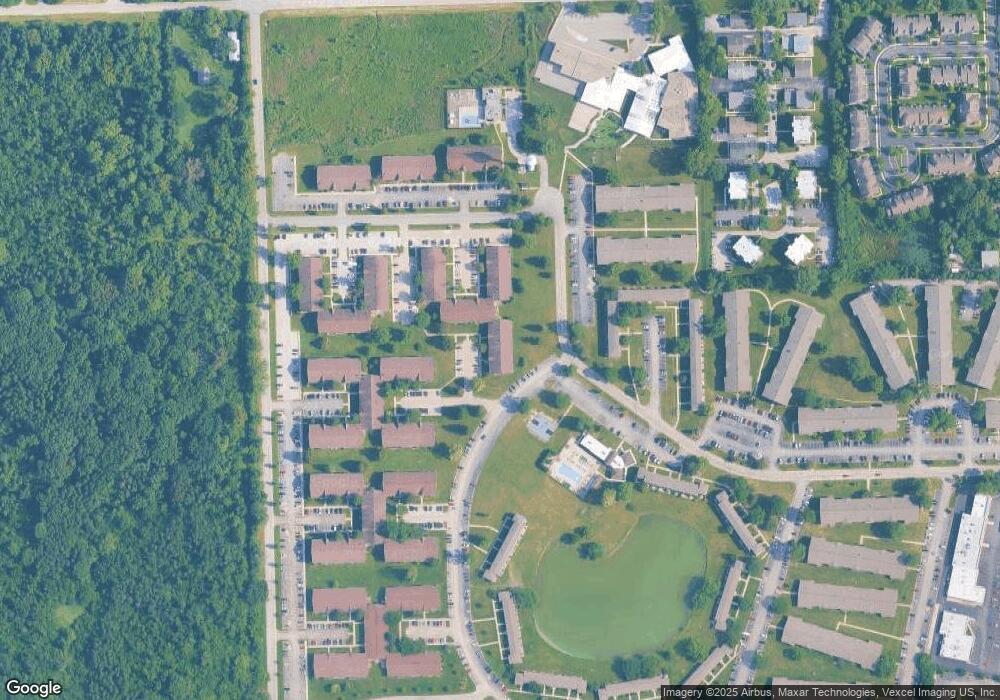
Map
Nearby Homes
- 14B Kingery Quarter Unit 207
- 4A Kingery Quarter Unit 104
- 5B Kingery Quarter Unit 107
- 24A Kingery Quarter Unit 202
- 11B Kingery Quarter Unit 107
- 2B Kingery Quarter Unit 207
- 12B Kingery Quarter Unit 108
- 9A Kingery Quarter Unit 202
- 22A Kingery Quarter Unit 202
- 13 Kingery Quarter Unit 106B
- 17W060 Burr Oak Ln
- 10S220 Hampshire Ln W
- 16W318 95th Place
- 4 Oak Hill Ct
- 16W234 91st St
- 16W340 97th St
- 11S047 Palisades Rd
- 17W033 87th St
- 9233 Falling Waters Dr W
- 10S111 Leonard Dr
- 5A Kingery Quarter Unit 103
- 21B Kingery Quarter Unit 105
- 21B Kingery Quarter Unit 206
- 5A Kingery Quarter Unit 201
- 21B Kingery Quarter Unit 207
- 5A Kingery Quarter Unit 203
- 5A Kingery Quarter Unit 5104
- 5A Kingery Quarter Unit 102
- 21B Kingery Quarter Unit 208
- 21B Kingery Quarter Unit 108
- 5A Kingery Quarter Unit 104
- 21B Kingery Quarter Unit 106
- 11A Kingery Quarter Unit 201
- 11A Kingery Quarter Unit 11103
- 11A Kingery Quarter Unit 102
- 11A Kingery Quarter Unit 204
- 11A Kingery Quarter Unit 203
- 11A Kingery Quarter Unit 104
- 11A Kingery Quarter Unit 103
- 13 Kingery Quarter Unit 108