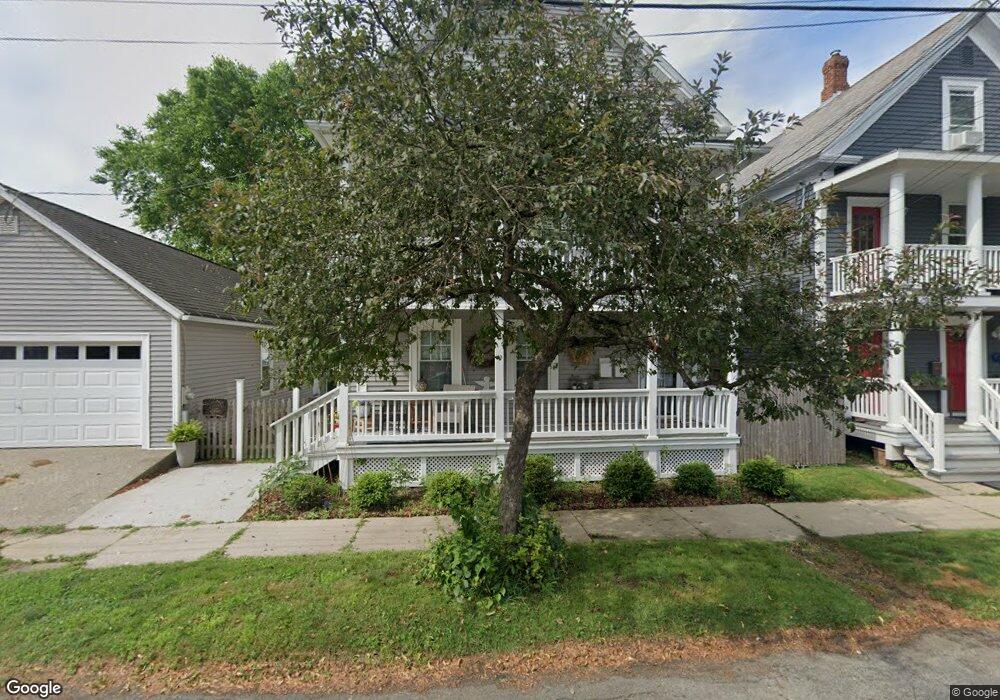
22 11th St Turners Falls, MA 01376
Estimated Value: $272,000 - $349,000
3
Beds
3
Baths
1,728
Sq Ft
$172/Sq Ft
Est. Value
About This Home
This home is located at 22 11th St, Turners Falls, MA 01376 and is currently estimated at $298,038, approximately $172 per square foot. 22 11th St is a home located in Franklin County with nearby schools including Turners Fall High School, Holy Trinity School, and Four Winds School.
Ownership History
Date
Name
Owned For
Owner Type
Purchase Details
Closed on
Dec 16, 2010
Sold by
Belden Kady
Bought by
Pelland Lynn
Current Estimated Value
Home Financials for this Owner
Home Financials are based on the most recent Mortgage that was taken out on this home.
Original Mortgage
$129,259
Outstanding Balance
$83,426
Interest Rate
4.23%
Mortgage Type
Purchase Money Mortgage
Estimated Equity
$214,612
Purchase Details
Closed on
Jun 29, 2010
Sold by
Perwak Edward F Est
Bought by
Belden Kady
Purchase Details
Closed on
Aug 20, 2001
Sold by
Montague Nt and Eagle
Bought by
Perwak Edward
Home Financials for this Owner
Home Financials are based on the most recent Mortgage that was taken out on this home.
Original Mortgage
$68,000
Interest Rate
7.16%
Mortgage Type
Purchase Money Mortgage
Create a Home Valuation Report for This Property
The Home Valuation Report is an in-depth analysis detailing your home's value as well as a comparison with similar homes in the area
Home Values in the Area
Average Home Value in this Area
Purchase History
| Date | Buyer | Sale Price | Title Company |
|---|---|---|---|
| Pelland Lynn | $131,000 | -- | |
| Pelland Lynn | $131,000 | -- | |
| Pelland Lynn | $131,000 | -- | |
| Belden Kady | -- | -- | |
| Belden Kady J | -- | -- | |
| Belden Kady | -- | -- | |
| Perwak Edward | $88,000 | -- | |
| Perwak Edward | $88,000 | -- |
Source: Public Records
Mortgage History
| Date | Status | Borrower | Loan Amount |
|---|---|---|---|
| Open | Pelland Lynn | $129,259 | |
| Closed | Perwak Edward | $129,259 | |
| Previous Owner | Perwak Edward | $68,000 |
Source: Public Records
Tax History
| Year | Tax Paid | Tax Assessment Tax Assessment Total Assessment is a certain percentage of the fair market value that is determined by local assessors to be the total taxable value of land and additions on the property. | Land | Improvement |
|---|---|---|---|---|
| 2025 | $2,876 | $189,100 | $53,300 | $135,800 |
| 2024 | $2,887 | $183,900 | $53,300 | $130,600 |
| 2023 | $2,768 | $176,900 | $53,300 | $123,600 |
| 2022 | $2,965 | $176,900 | $53,300 | $123,600 |
| 2021 | $2,578 | $147,800 | $40,000 | $107,800 |
| 2020 | $563 | $147,800 | $40,000 | $107,800 |
| 2019 | $2,559 | $149,400 | $50,000 | $99,400 |
| 2018 | $405 | $149,400 | $50,000 | $99,400 |
| 2017 | $403 | $149,400 | $50,000 | $99,400 |
| 2016 | $2,365 | $134,300 | $37,400 | $96,900 |
| 2015 | $2,278 | $134,300 | $37,400 | $96,900 |
| 2014 | $2,194 | $134,300 | $37,400 | $96,900 |
Source: Public Records
Map
Nearby Homes
- 63 Davis St
- 104 Silver St
- 37 Cleveland St
- 208 Silver St
- 001 Adams Rd
- 171 Cleveland St
- 306 Country Side Rd
- 14-16 Abbott St
- 183 Millers Falls Rd
- 31 Lovers Ln
- 52 Prospect St Unit A
- 0 Marshall St
- 173-175 Conway St
- 59-61 Conway St
- 11 Conway St
- 73 Washington St
- 71 Washington St
- 77 Washington St
- 8 Water St
- 2 Water St
Your Personal Tour Guide
Ask me questions while you tour the home.