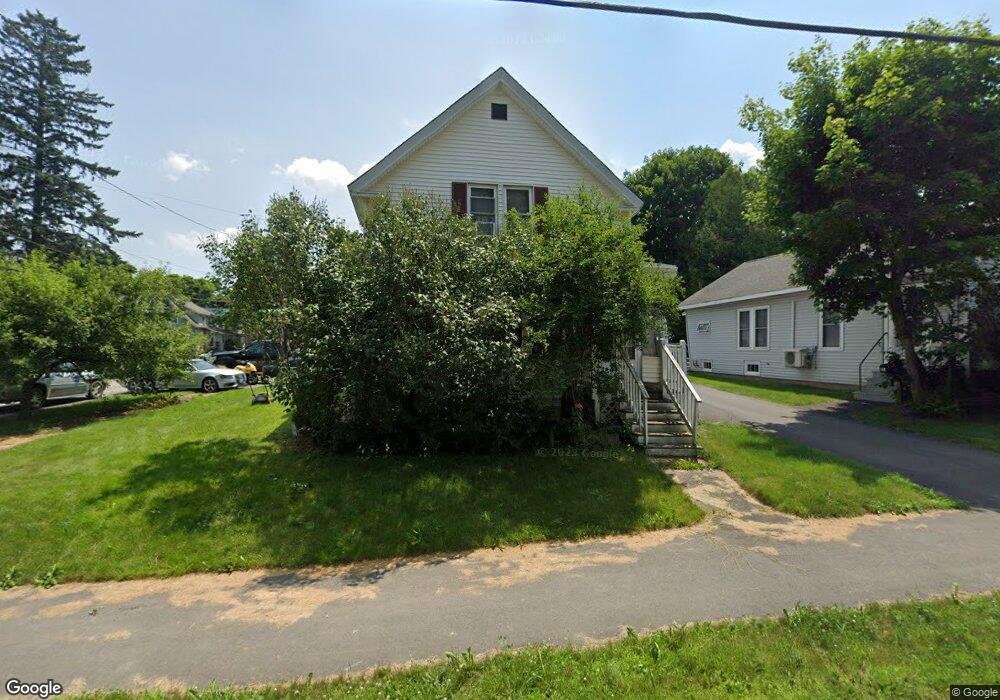
22 14th St Bangor, ME 04401
West Bangor NeighborhoodEstimated Value: $222,473 - $251,000
2
Beds
2
Baths
1,235
Sq Ft
$191/Sq Ft
Est. Value
About This Home
This home is located at 22 14th St, Bangor, ME 04401 and is currently estimated at $236,368, approximately $191 per square foot. 22 14th St is a home located in Penobscot County with nearby schools including Fourteenth Street School, Fairmount School, and James F. Doughty School.
Ownership History
Date
Name
Owned For
Owner Type
Purchase Details
Closed on
May 23, 2024
Sold by
Purvis George T
Bought by
Smart Christina
Current Estimated Value
Home Financials for this Owner
Home Financials are based on the most recent Mortgage that was taken out on this home.
Original Mortgage
$123,750
Outstanding Balance
$122,015
Interest Rate
6.88%
Mortgage Type
Commercial
Estimated Equity
$114,353
Create a Home Valuation Report for This Property
The Home Valuation Report is an in-depth analysis detailing your home's value as well as a comparison with similar homes in the area
Home Values in the Area
Average Home Value in this Area
Purchase History
| Date | Buyer | Sale Price | Title Company |
|---|---|---|---|
| Smart Christina | $165,000 | None Available | |
| Smart Christina | $165,000 | None Available |
Source: Public Records
Mortgage History
| Date | Status | Borrower | Loan Amount |
|---|---|---|---|
| Open | Smart Christina | $123,750 | |
| Closed | Smart Christina | $123,750 |
Source: Public Records
Tax History Compared to Growth
Tax History
| Year | Tax Paid | Tax Assessment Tax Assessment Total Assessment is a certain percentage of the fair market value that is determined by local assessors to be the total taxable value of land and additions on the property. | Land | Improvement |
|---|---|---|---|---|
| 2024 | $3,411 | $183,900 | $15,000 | $168,900 |
| 2023 | $3,206 | $167,400 | $15,000 | $152,400 |
| 2022 | $2,964 | $145,300 | $15,000 | $130,300 |
| 2021 | $2,825 | $126,700 | $13,900 | $112,800 |
| 2020 | $2,798 | $120,600 | $13,600 | $107,000 |
| 2019 | $2,682 | $116,600 | $13,600 | $103,000 |
| 2018 | $2,538 | $110,600 | $13,600 | $97,000 |
| 2017 | $2,438 | $108,100 | $13,600 | $94,500 |
| 2016 | $2,378 | $105,700 | $13,600 | $92,100 |
| 2015 | $2,320 | $105,700 | $13,600 | $92,100 |
| 2014 | $2,261 | $103,700 | $13,600 | $90,100 |
| 2013 | $2,157 | $103,700 | $13,600 | $90,100 |
Source: Public Records
Map
Nearby Homes