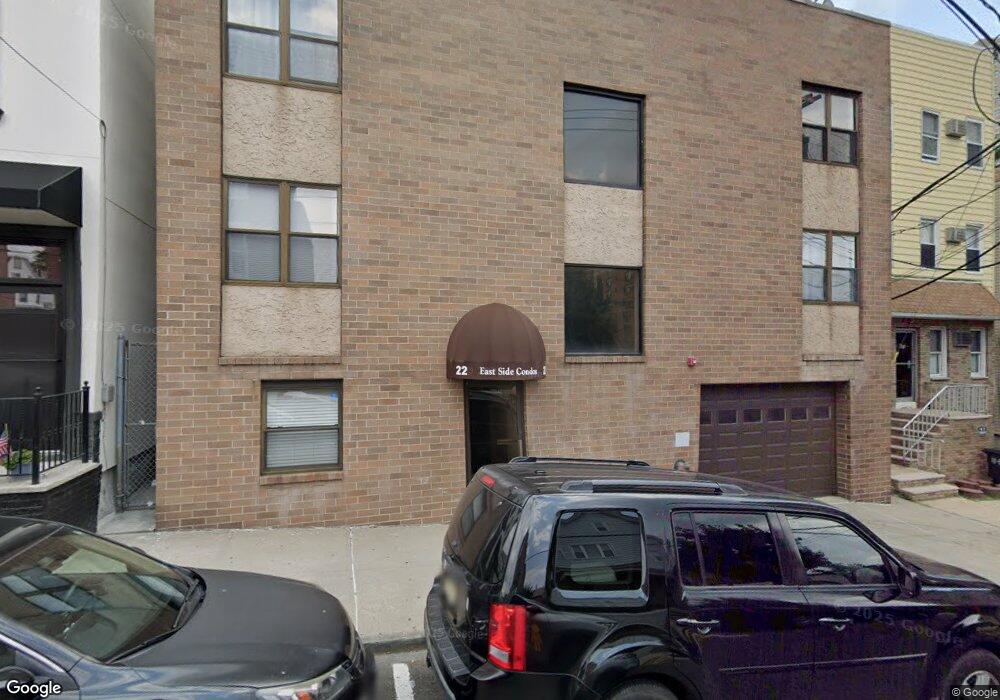
22 69th St Unit B2 Guttenberg, NJ 07093
Estimated Value: $229,000 - $342,000
1
Bed
1
Bath
725
Sq Ft
$405/Sq Ft
Est. Value
About This Home
This home is located at 22 69th St Unit B2, Guttenberg, NJ 07093 and is currently estimated at $293,672, approximately $405 per square foot. 22 69th St Unit B2 is a home located in Hudson County with nearby schools including Anna L. Klein Elementary School.
Ownership History
Date
Name
Owned For
Owner Type
Purchase Details
Closed on
Jan 22, 2010
Sold by
Principe Nora M and Elatwey Sami
Bought by
Schipilliti Joseph and Schipilliti Marianita D
Current Estimated Value
Home Financials for this Owner
Home Financials are based on the most recent Mortgage that was taken out on this home.
Original Mortgage
$127,500
Outstanding Balance
$84,135
Interest Rate
5.05%
Mortgage Type
Purchase Money Mortgage
Estimated Equity
$209,537
Purchase Details
Closed on
May 29, 2002
Sold by
Elaprak Abdalla Said
Bought by
Elatwey Sami
Purchase Details
Closed on
Jul 19, 2001
Sold by
Lange Mayra and Perez Mayra
Bought by
Elaprak Abdalla Said
Home Financials for this Owner
Home Financials are based on the most recent Mortgage that was taken out on this home.
Original Mortgage
$103,500
Interest Rate
7.21%
Create a Home Valuation Report for This Property
The Home Valuation Report is an in-depth analysis detailing your home's value as well as a comparison with similar homes in the area
Home Values in the Area
Average Home Value in this Area
Purchase History
| Date | Buyer | Sale Price | Title Company |
|---|---|---|---|
| Schipilliti Joseph | $170,000 | -- | |
| Elatwey Sami | $100,000 | Lawyers Title Insurance Corp | |
| Elaprak Abdalla Said | $115,000 | Stewart Title Guaranty Compa |
Source: Public Records
Mortgage History
| Date | Status | Borrower | Loan Amount |
|---|---|---|---|
| Open | Schipilliti Joseph | $127,500 | |
| Previous Owner | Elaprak Abdalla Said | $103,500 |
Source: Public Records
Tax History Compared to Growth
Tax History
| Year | Tax Paid | Tax Assessment Tax Assessment Total Assessment is a certain percentage of the fair market value that is determined by local assessors to be the total taxable value of land and additions on the property. | Land | Improvement |
|---|---|---|---|---|
| 2025 | $4,603 | $111,500 | $50,000 | $61,500 |
| 2024 | $4,453 | $111,500 | $50,000 | $61,500 |
| 2023 | $4,453 | $111,500 | $50,000 | $61,500 |
| 2022 | $4,323 | $111,500 | $50,000 | $61,500 |
| 2021 | $4,328 | $111,500 | $50,000 | $61,500 |
| 2020 | $4,305 | $111,500 | $50,000 | $61,500 |
| 2019 | $4,270 | $111,500 | $50,000 | $61,500 |
| 2018 | $4,156 | $111,500 | $50,000 | $61,500 |
| 2017 | $4,098 | $111,500 | $50,000 | $61,500 |
| 2016 | $4,070 | $111,500 | $50,000 | $61,500 |
| 2015 | $4,579 | $126,500 | $50,000 | $76,500 |
| 2014 | $5,009 | $141,500 | $50,000 | $91,500 |
Source: Public Records
Map
Nearby Homes
- 61 69th St Unit C3
- 56 68th St Unit 8
- 56 68th St Unit . 8
- 56 68th St Unit 5
- 62 69th St Unit 503
- 6701 Jfk Blvd E Unit E2
- 6701 Jfk Blvd E Unit E1
- 6701 Jfk Blvd E Unit C7
- 7000 Boulevard E Unit 39F
- 7000 Boulevard E Unit 26K
- 55 71st St
- 83 68th St Unit 3
- 7000 Kennedy Blvd E Unit 36C
- 7000 Blvd E Unit 44B
- 7000 Blvd E Unit 39F
- 7000 Blvd E Unit 19D
- 7000 Blvd E Unit 18C
- 7000 Blvd E Unit 35G
- 7000 Blvd E Unit 22C
- 7000 Blvd E Unit 46A
- 22 69th St Unit C2
- 22 69th St Unit A1
- 22 69th St Unit C5
- 22 69th St Unit B5
- 22 69th St Unit B3
- 22 69th St Unit B4
- 22 69th St Unit C4
- 22 69th St Unit C3
- 22 69th St Unit C1
- 22 69th St Unit B1
- 22 69th St
- 18 69th St Unit 3B
- 18 69th St Unit 3A
- 18 69th St Unit 2B
- 18 69th St Unit 2A
- 18 69th St Unit 1D
- 18 69th St Unit 1C
- 18 69th St Unit 1B
- 18 69th St Unit 1A
- 18 69th St Unit S1