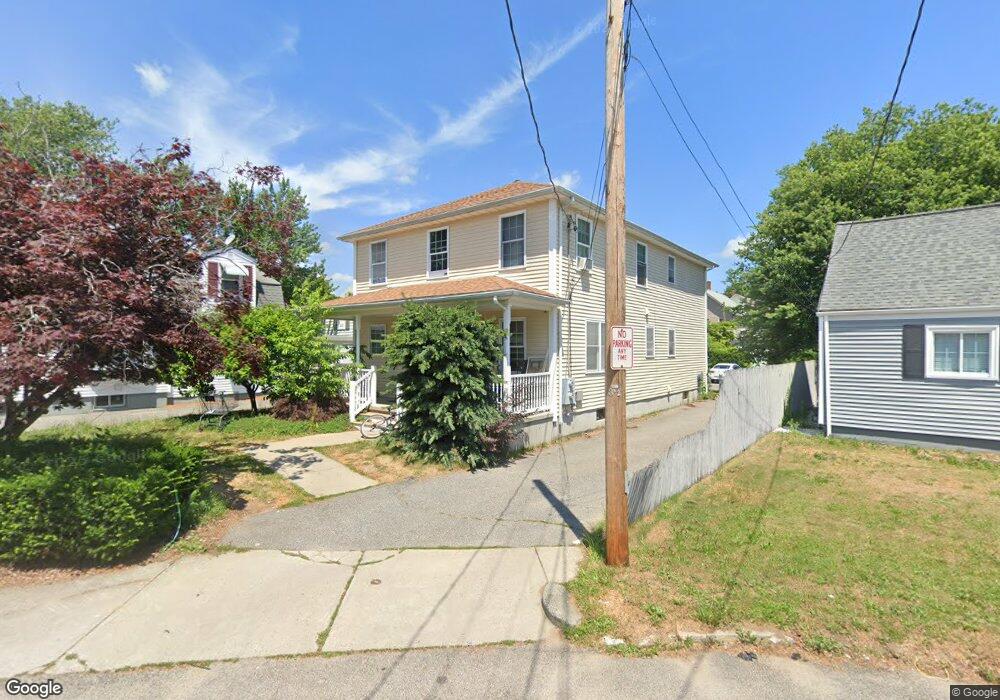
22 Aiken St Pawtucket, RI 02861
Darlington NeighborhoodEstimated Value: $555,710 - $594,000
6
Beds
2
Baths
3,448
Sq Ft
$168/Sq Ft
Est. Value
About This Home
This home is located at 22 Aiken St, Pawtucket, RI 02861 and is currently estimated at $579,928, approximately $168 per square foot. 22 Aiken St is a home located in Providence County with nearby schools including St Cecilia School and Saint Raphael Academy.
Ownership History
Date
Name
Owned For
Owner Type
Purchase Details
Closed on
May 31, 2023
Sold by
Terry Alan
Bought by
Terry Alan and Ferretti Audrey J
Current Estimated Value
Home Financials for this Owner
Home Financials are based on the most recent Mortgage that was taken out on this home.
Original Mortgage
$347,221
Outstanding Balance
$335,971
Interest Rate
5.75%
Mortgage Type
FHA
Estimated Equity
$243,957
Purchase Details
Closed on
Mar 21, 2023
Sold by
Terry Alan and Terry Sekina
Bought by
Terry Alan
Purchase Details
Closed on
Jul 6, 2021
Sold by
Dumont Brian M and Dumont Darrell R
Bought by
Terry Alan and Terry Sekina
Home Financials for this Owner
Home Financials are based on the most recent Mortgage that was taken out on this home.
Original Mortgage
$382,936
Interest Rate
2.9%
Mortgage Type
FHA
Create a Home Valuation Report for This Property
The Home Valuation Report is an in-depth analysis detailing your home's value as well as a comparison with similar homes in the area
Home Values in the Area
Average Home Value in this Area
Purchase History
| Date | Buyer | Sale Price | Title Company |
|---|---|---|---|
| Terry Alan | -- | None Available | |
| Terry Alan | -- | None Available | |
| Terry Alan | -- | None Available | |
| Terry Alan | -- | None Available | |
| Terry Alan | $390,000 | None Available | |
| Terry Alan | $390,000 | None Available |
Source: Public Records
Mortgage History
| Date | Status | Borrower | Loan Amount |
|---|---|---|---|
| Open | Terry Alan | $347,221 | |
| Closed | Terry Alan | $347,221 | |
| Previous Owner | Terry Alan | $382,936 |
Source: Public Records
Tax History Compared to Growth
Tax History
| Year | Tax Paid | Tax Assessment Tax Assessment Total Assessment is a certain percentage of the fair market value that is determined by local assessors to be the total taxable value of land and additions on the property. | Land | Improvement |
|---|---|---|---|---|
| 2025 | $6,444 | $490,000 | $128,500 | $361,500 |
| 2024 | $6,047 | $490,000 | $128,500 | $361,500 |
| 2023 | $5,792 | $341,900 | $80,400 | $261,500 |
| 2022 | $5,669 | $341,900 | $80,400 | $261,500 |
| 2021 | $5,669 | $341,900 | $80,400 | $261,500 |
| 2020 | $4,949 | $236,900 | $63,500 | $173,400 |
| 2019 | $4,949 | $236,900 | $63,500 | $173,400 |
| 2018 | $4,769 | $236,900 | $63,500 | $173,400 |
| 2017 | $4,478 | $197,100 | $53,100 | $144,000 |
| 2016 | $4,315 | $197,100 | $53,100 | $144,000 |
| 2015 | $4,315 | $197,100 | $53,100 | $144,000 |
| 2014 | $4,291 | $186,100 | $53,100 | $133,000 |
Source: Public Records
Map
Nearby Homes