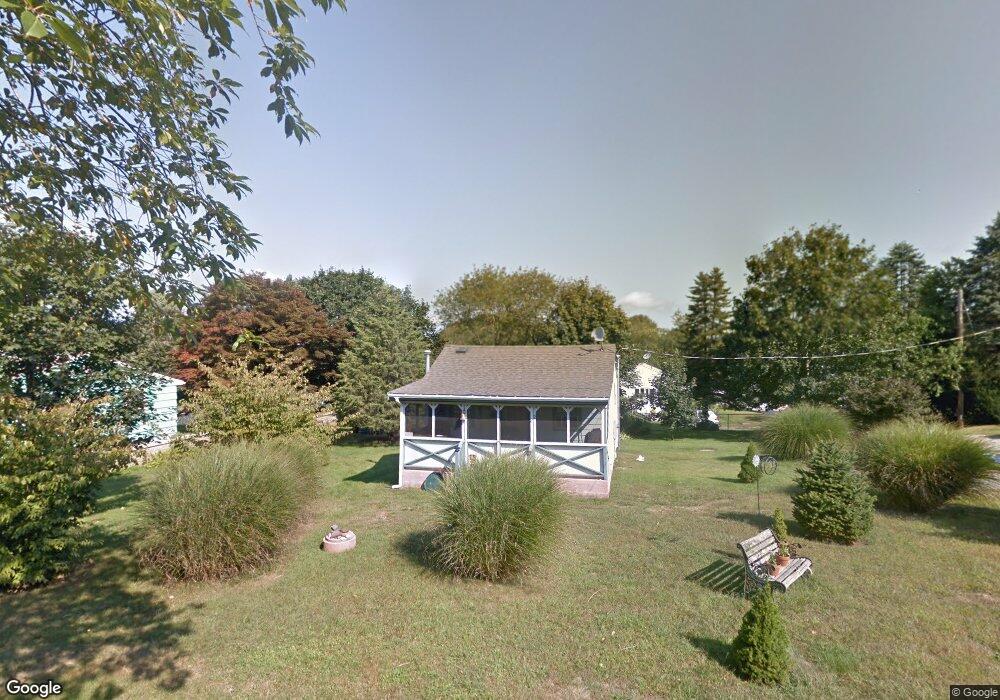
22 Anthony Way Tiverton, RI 02878
Estimated Value: $289,177 - $553,000
2
Beds
1
Bath
480
Sq Ft
$887/Sq Ft
Est. Value
About This Home
This home is located at 22 Anthony Way, Tiverton, RI 02878 and is currently estimated at $425,794, approximately $887 per square foot. 22 Anthony Way is a home located in Newport County with nearby schools including Tiverton High School.
Ownership History
Date
Name
Owned For
Owner Type
Purchase Details
Closed on
Sep 27, 2002
Sold by
Pitts Amy Kathleen
Bought by
Faria John M
Current Estimated Value
Purchase Details
Closed on
Nov 6, 2000
Sold by
Piffard Stacia Cory
Bought by
Pitts Amy K
Purchase Details
Closed on
Nov 22, 1995
Sold by
Mills Albert H
Bought by
Ford Stacia Cory
Create a Home Valuation Report for This Property
The Home Valuation Report is an in-depth analysis detailing your home's value as well as a comparison with similar homes in the area
Home Values in the Area
Average Home Value in this Area
Purchase History
| Date | Buyer | Sale Price | Title Company |
|---|---|---|---|
| Faria John M | $95,000 | -- | |
| Pitts Amy K | $89,000 | -- | |
| Ford Stacia Cory | $67,000 | -- |
Source: Public Records
Mortgage History
| Date | Status | Borrower | Loan Amount |
|---|---|---|---|
| Open | Ford Stacia Cory | $173,000 | |
| Closed | Ford Stacia Cory | $138,750 | |
| Closed | Ford Stacia Cory | $35,000 |
Source: Public Records
Tax History
| Year | Tax Paid | Tax Assessment Tax Assessment Total Assessment is a certain percentage of the fair market value that is determined by local assessors to be the total taxable value of land and additions on the property. | Land | Improvement |
|---|---|---|---|---|
| 2025 | $2,087 | $184,200 | $119,100 | $65,100 |
| 2024 | $2,035 | $184,200 | $119,100 | $65,100 |
| 2023 | $2,283 | $153,200 | $106,100 | $47,100 |
| 2022 | $2,241 | $153,200 | $106,100 | $47,100 |
| 2021 | $2,186 | $153,200 | $106,100 | $47,100 |
| 2020 | $1,873 | $115,700 | $77,400 | $38,300 |
| 2019 | $1,827 | $115,700 | $77,400 | $38,300 |
| 2018 | $1,896 | $115,700 | $77,400 | $38,300 |
| 2017 | $2,275 | $119,400 | $74,900 | $44,500 |
| 2016 | $2,285 | $119,400 | $74,900 | $44,500 |
| 2015 | $2,260 | $118,100 | $74,900 | $43,200 |
| 2014 | $2,059 | $106,700 | $71,900 | $34,800 |
Source: Public Records
Map
Nearby Homes
- 7 Peckham Ln
- 30 Anthony Way
- 0 Peckham Ln Unit 623429
- 0 Peckham Ln Unit 1325814
- 0 Peckham Ln Unit 1012756
- 15 Peckham Ln
- 15 Faria Way
- 16 Peckham Ln
- 5 W Main Rd
- 0 Anthony Way
- 13 Edmond Ln
- 11 W Main Rd
- 0 Edmond Ln
- 30 Edmond Ln
- 26 Peckham Ln
- 62 Anthony Way
- 11 W Main Rd
- 6 W Main Rd
- 26 Faria Way
- 12 Preston Ln
Your Personal Tour Guide
Ask me questions while you tour the home.