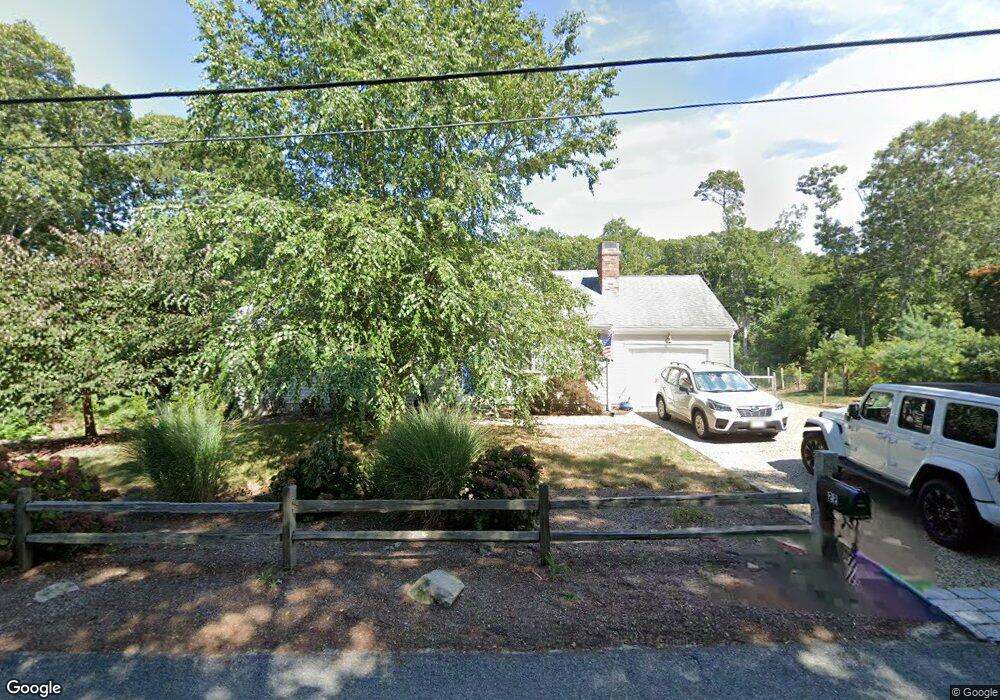
22 Apache Dr Yarmouth Port, MA 02675
Yarmouth Port NeighborhoodEstimated Value: $603,837 - $673,000
3
Beds
2
Baths
1,144
Sq Ft
$558/Sq Ft
Est. Value
About This Home
This home is located at 22 Apache Dr, Yarmouth Port, MA 02675 and is currently estimated at $638,209, approximately $557 per square foot. 22 Apache Dr is a home located in Barnstable County with nearby schools including Dennis-Yarmouth Regional High School.
Ownership History
Date
Name
Owned For
Owner Type
Purchase Details
Closed on
May 30, 2012
Sold by
Glynn Paul
Bought by
Paul C Glynn Lt and Glynn Paul C
Current Estimated Value
Purchase Details
Closed on
Apr 1, 2010
Sold by
Wabash Constr
Bought by
Glynn Paul
Purchase Details
Closed on
Mar 8, 2010
Sold by
Jp Morgan Chase Bk
Bought by
Wabash Constr
Purchase Details
Closed on
Jan 4, 2010
Sold by
Westerling Brandon
Bought by
Jp Morgan Chase Bk
Purchase Details
Closed on
Mar 22, 2007
Sold by
Sugar Ray Realty Corp
Bought by
Westerling Brandon
Home Financials for this Owner
Home Financials are based on the most recent Mortgage that was taken out on this home.
Original Mortgage
$1,065,000
Interest Rate
6.33%
Mortgage Type
Purchase Money Mortgage
Purchase Details
Closed on
Dec 29, 2005
Sold by
Mtg Electron Registrat and Mcgowan Mary I
Bought by
Sugar Ray Rlty Corp
Home Financials for this Owner
Home Financials are based on the most recent Mortgage that was taken out on this home.
Original Mortgage
$266,000
Interest Rate
6.39%
Mortgage Type
Purchase Money Mortgage
Create a Home Valuation Report for This Property
The Home Valuation Report is an in-depth analysis detailing your home's value as well as a comparison with similar homes in the area
Home Values in the Area
Average Home Value in this Area
Purchase History
| Date | Buyer | Sale Price | Title Company |
|---|---|---|---|
| Paul C Glynn Lt | -- | -- | |
| Glynn Paul | $252,668 | -- | |
| Wabash Constr | $230,000 | -- | |
| Jp Morgan Chase Bk | $140,300 | -- | |
| Westerling Brandon | -- | -- | |
| Sugar Ray Rlty Corp | $237,500 | -- |
Source: Public Records
Mortgage History
| Date | Status | Borrower | Loan Amount |
|---|---|---|---|
| Previous Owner | Westerling Brandon | $1,065,000 | |
| Previous Owner | Sugar Ray Rlty Corp | $266,000 |
Source: Public Records
Tax History Compared to Growth
Tax History
| Year | Tax Paid | Tax Assessment Tax Assessment Total Assessment is a certain percentage of the fair market value that is determined by local assessors to be the total taxable value of land and additions on the property. | Land | Improvement |
|---|---|---|---|---|
| 2025 | $3,850 | $543,800 | $176,400 | $367,400 |
| 2024 | $3,624 | $491,000 | $153,400 | $337,600 |
| 2023 | $3,542 | $436,700 | $139,400 | $297,300 |
| 2022 | $3,396 | $369,900 | $133,100 | $236,800 |
| 2021 | $3,192 | $333,900 | $133,100 | $200,800 |
| 2020 | $3,200 | $320,000 | $140,900 | $179,100 |
| 2019 | $2,970 | $294,100 | $140,900 | $153,200 |
| 2018 | $2,784 | $270,600 | $117,400 | $153,200 |
| 2017 | $2,711 | $270,600 | $117,400 | $153,200 |
| 2016 | $2,607 | $261,200 | $108,000 | $153,200 |
| 2015 | $2,431 | $242,100 | $103,300 | $138,800 |
Source: Public Records
Map
Nearby Homes
- 6 Nimble Hill Dr
- 44 Stratford Ln
- 64 Kates Path
- 800 Route 6a
- 800 Route 6a
- 43 Canterbury Rd
- 59 Route 6a Unit 29-4
- 17 Kates Path Unit A
- 228 Kates Path
- 19 John Halls Cartpath Village Unit E
- 42 John Hall Cartway Unit 42
- 19 John Hall Cartway Unit E
- 50 John Hall Cartway
- 50 John Hall Cartway Unit 50
- 13 Covey Dr
- 111 Merchant Ave
- 158 Kates Path
- 21 Boxwood Cir
- 28 Oak Glen
- 25 Oak Glen Village Unit 25