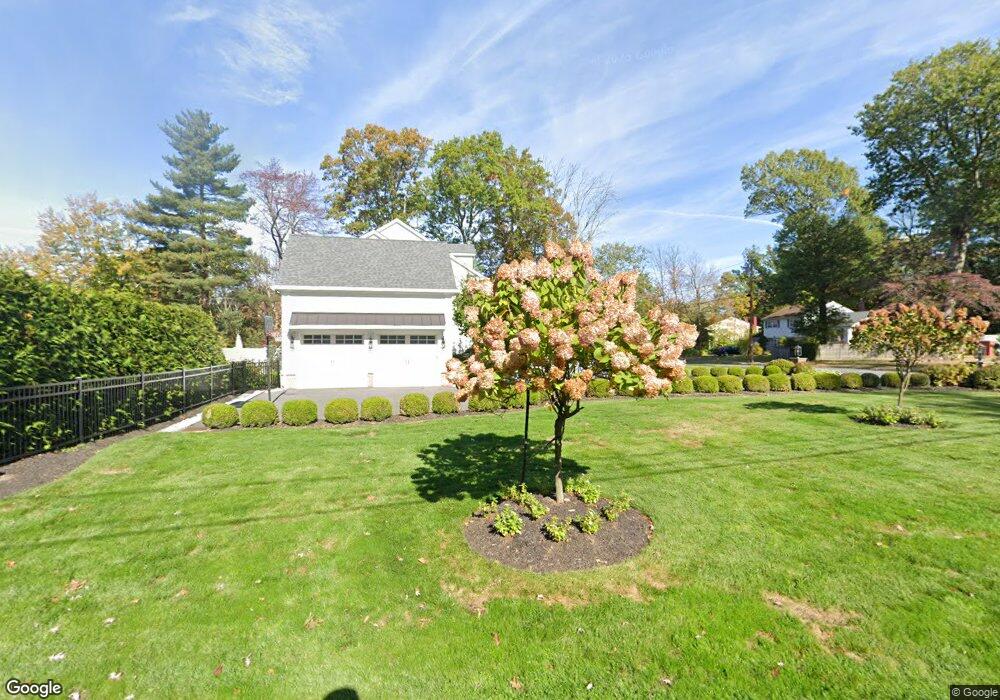
22 Badger Dr Livingston, NJ 07039
Estimated Value: $1,450,000 - $1,892,460
--
Bed
--
Bath
1,190
Sq Ft
$1,341/Sq Ft
Est. Value
About This Home
This home is located at 22 Badger Dr, Livingston, NJ 07039 and is currently estimated at $1,595,615, approximately $1,340 per square foot. 22 Badger Dr is a home located in Essex County with nearby schools including Livingston Sr High School and Aquinas Academy.
Ownership History
Date
Name
Owned For
Owner Type
Purchase Details
Closed on
Mar 8, 2019
Sold by
Mtglq Investors Lp
Bought by
Rosenblum Jeffrey and Rosenblum Kelly
Current Estimated Value
Purchase Details
Closed on
Sep 22, 2004
Purchase Details
Closed on
Jun 25, 1998
Sold by
Hlad Edward
Bought by
Jang Ok S
Home Financials for this Owner
Home Financials are based on the most recent Mortgage that was taken out on this home.
Original Mortgage
$123,900
Interest Rate
6.87%
Create a Home Valuation Report for This Property
The Home Valuation Report is an in-depth analysis detailing your home's value as well as a comparison with similar homes in the area
Home Values in the Area
Average Home Value in this Area
Purchase History
| Date | Buyer | Sale Price | Title Company |
|---|---|---|---|
| Rosenblum Jeffrey | $490,000 | -- | |
| -- | -- | -- | |
| Jang Ok S | $165,200 | -- |
Source: Public Records
Mortgage History
| Date | Status | Borrower | Loan Amount |
|---|---|---|---|
| Previous Owner | Jang Ok S | $123,900 |
Source: Public Records
Tax History Compared to Growth
Tax History
| Year | Tax Paid | Tax Assessment Tax Assessment Total Assessment is a certain percentage of the fair market value that is determined by local assessors to be the total taxable value of land and additions on the property. | Land | Improvement |
|---|---|---|---|---|
| 2025 | $28,433 | $1,198,700 | $385,600 | $813,100 |
| 2024 | $28,433 | $1,198,700 | $385,600 | $813,100 |
| 2022 | $27,966 | $1,198,700 | $385,600 | $813,100 |
| 2021 | $20,493 | $885,600 | $385,600 | $500,000 |
| 2020 | $9,325 | $410,600 | $385,600 | $25,000 |
| 2019 | $12,654 | $483,700 | $350,600 | $133,100 |
| 2018 | $12,484 | $483,700 | $350,600 | $133,100 |
| 2017 | $12,320 | $483,700 | $350,600 | $133,100 |
| 2016 | $12,093 | $483,700 | $350,600 | $133,100 |
| 2015 | $11,914 | $483,700 | $350,600 | $133,100 |
| 2014 | $11,527 | $483,700 | $350,600 | $133,100 |
Source: Public Records
Map
Nearby Homes