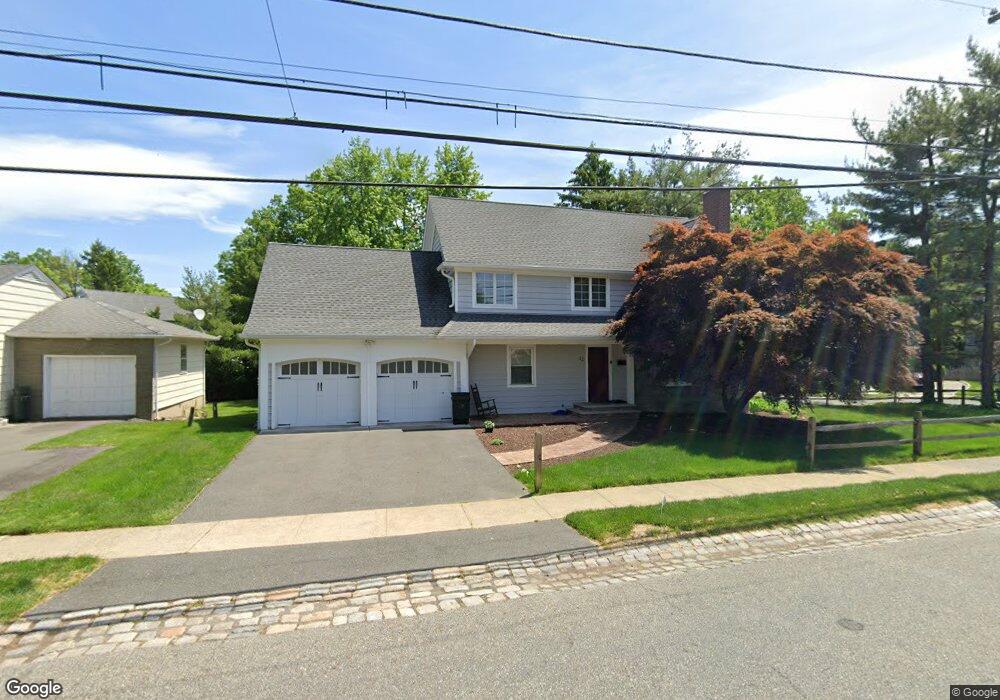
22 Baltusrol Way Short Hills, NJ 07078
Estimated Value: $1,454,000 - $1,679,000
--
Bed
--
Bath
2,305
Sq Ft
$673/Sq Ft
Est. Value
About This Home
This home is located at 22 Baltusrol Way, Short Hills, NJ 07078 and is currently estimated at $1,552,112, approximately $673 per square foot. 22 Baltusrol Way is a home located in Essex County with nearby schools including Glenwood Elementary School, Millburn Middle School, and Millburn High School.
Ownership History
Date
Name
Owned For
Owner Type
Purchase Details
Closed on
May 10, 2003
Sold by
Kasden Alexander
Bought by
Pharon Basem and Griffin Loretta
Current Estimated Value
Purchase Details
Closed on
May 20, 2002
Sold by
Kasdan Alexander
Bought by
Griffin Loretta and Pahraon Basem
Home Financials for this Owner
Home Financials are based on the most recent Mortgage that was taken out on this home.
Original Mortgage
$464,400
Interest Rate
7%
Purchase Details
Closed on
Mar 22, 2000
Sold by
Singh Sushaia
Bought by
Kasdan Alexander and Kasdan Tania
Home Financials for this Owner
Home Financials are based on the most recent Mortgage that was taken out on this home.
Original Mortgage
$285,000
Interest Rate
8.3%
Purchase Details
Closed on
Jan 6, 1993
Sold by
Pampalone Thomas J and Pampalone April
Bought by
Singh Sushma
Create a Home Valuation Report for This Property
The Home Valuation Report is an in-depth analysis detailing your home's value as well as a comparison with similar homes in the area
Home Values in the Area
Average Home Value in this Area
Purchase History
| Date | Buyer | Sale Price | Title Company |
|---|---|---|---|
| Pharon Basem | $355,500 | -- | |
| Griffin Loretta | $555,500 | -- | |
| Kasdan Alexander | $380,000 | -- | |
| Singh Sushma | $272,000 | -- |
Source: Public Records
Mortgage History
| Date | Status | Borrower | Loan Amount |
|---|---|---|---|
| Previous Owner | Griffin Loretta | $464,400 | |
| Previous Owner | Kasdan Alexander | $285,000 |
Source: Public Records
Tax History Compared to Growth
Tax History
| Year | Tax Paid | Tax Assessment Tax Assessment Total Assessment is a certain percentage of the fair market value that is determined by local assessors to be the total taxable value of land and additions on the property. | Land | Improvement |
|---|---|---|---|---|
| 2025 | $18,913 | $966,900 | $627,600 | $339,300 |
| 2024 | $18,913 | $966,900 | $627,600 | $339,300 |
| 2022 | $18,787 | $966,900 | $627,600 | $339,300 |
| 2021 | $18,739 | $966,900 | $627,600 | $339,300 |
| 2020 | $18,622 | $966,900 | $627,600 | $339,300 |
| 2019 | $18,661 | $966,900 | $627,600 | $339,300 |
| 2018 | $18,390 | $966,900 | $627,600 | $339,300 |
| 2017 | $17,946 | $966,900 | $627,600 | $339,300 |
| 2016 | $15,485 | $718,900 | $376,600 | $342,300 |
| 2015 | $15,133 | $718,900 | $376,600 | $342,300 |
| 2014 | $14,493 | $718,900 | $376,600 | $342,300 |
Source: Public Records
Map
Nearby Homes
- 72 Meadowbrook Rd
- 114 Short Hills Ave
- 12 Meadowbrook Rd
- 80 Great Oak Dr
- 7 Canterbury Ln
- 68 Colfax Rd
- 50 Great Oak Dr
- 170 Short Hills Ave
- 445 Morris Ave Unit 7
- 445 Morris Ave Unit 12
- 19 Bodwell Terrace
- 426 Millburn Ave Unit A
- 100 Hobart Ave
- 32 Wells Ln
- 19 Hawthorne Rd
- 40 Highland Ave
- 5B Troy Dr Unit 1
- 85B Troy Dr Unit 11
- 85A Troy Dr Unit 11
- 67 Montview Ave
- 28 Baltusrol Way
- 77 Meadowbrook Rd
- 29 Baltusrol Way
- 70 Meadowbrook Rd
- 74 Meadowbrook Rd
- 68 Meadowbrook Rd
- 58 Elmwood Place
- 76 Meadowbrook Rd
- 30 Baltusrol Way
- 79 Meadowbrook Rd
- 61 Meadowbrook Rd
- 78 Meadowbrook Rd
- 56 Elmwood Place
- 59 Meadowbrook Rd
- 35 Baltusrol Way
- 80 Meadowbrook Rd
- 21 Glenwood Dr
- 25 Glenwood Dr
- 54 Elmwood Place
- 27 Glenwood Dr