
Seller's Agent in 2017
Nile Morin
Oceanside Realty Group
(774) 836-6953
7 in this area
49 Total Sales


Estimated Value: $600,000 - $680,260
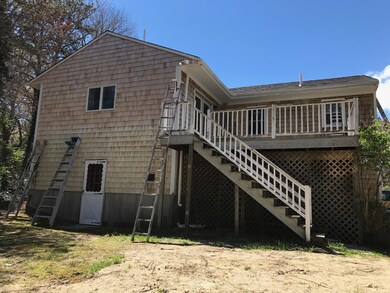
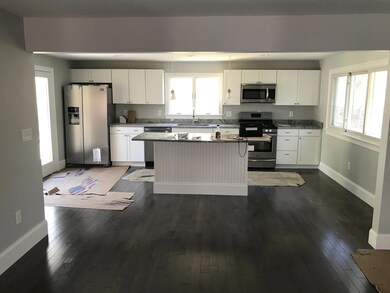
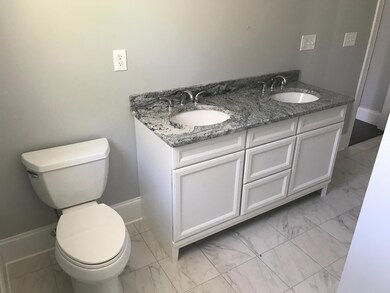
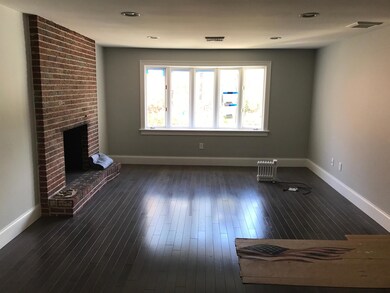
Completely remodeled raised ranch.
Last Agent to Sell the Property
Oceanside Realty Group License #9532645 Listed on: 05/10/2017
Last Buyer's Agent
Nile Morin
Kalstar Realty Services
| Date | Buyer | Sale Price | Title Company |
|---|---|---|---|
| Zibutis James | $352,500 | -- | |
| M & M Realty Group Inc | $188,000 | -- |
| Date | Status | Borrower | Loan Amount |
|---|---|---|---|
| Open | Zibutis James | $346,114 | |
| Previous Owner | M & M Realty Group Inc | $230,000 |
| Date | Event | Price | List to Sale | Price per Sq Ft |
|---|---|---|---|---|
| 05/12/2017 05/12/17 | Sold | $352,500 | -4.5% | $281 / Sq Ft |
| 05/12/2017 05/12/17 | Pending | -- | -- | -- |
| 05/11/2017 05/11/17 | For Sale | $369,000 | -- | $294 / Sq Ft |
| Year | Tax Paid | Tax Assessment Tax Assessment Total Assessment is a certain percentage of the fair market value that is determined by local assessors to be the total taxable value of land and additions on the property. | Land | Improvement |
|---|---|---|---|---|
| 2025 | $5,006 | $618,800 | $261,000 | $357,800 |
| 2024 | $4,907 | $628,300 | $261,000 | $367,300 |
| 2023 | $4,819 | $577,800 | $258,300 | $319,500 |
| 2022 | $4,171 | $432,700 | $165,400 | $267,300 |
| 2021 | $4,265 | $406,600 | $175,800 | $230,800 |
| 2020 | $3,873 | $353,400 | $124,100 | $229,300 |
| 2019 | $3,623 | $321,200 | $124,100 | $197,100 |
| 2018 | $3,378 | $301,100 | $136,100 | $165,000 |
| 2017 | $2,785 | $258,800 | $136,100 | $122,700 |
| 2016 | $3,025 | $277,500 | $137,200 | $140,300 |
| 2015 | $2,773 | $255,600 | $133,400 | $122,200 |
Seller's Agent in 2017
Nile Morin
Oceanside Realty Group
(774) 836-6953
7 in this area
49 Total Sales
Source: Cape Cod & Islands Association of REALTORS®
MLS Number: 21712013
APN: CENT-000168-000000-000050
Disclaimer: Certain information contained herein is derived from information provided by parties other than Homes.com. All information provided is deemed reliable, but is not guaranteed to be accurate and should be independently verified.
![]() All data relating to real estate for sale on this page comes from the Broker Reciprocity (BR) of the Cape Cod & Islands Multiple Listing Service, Inc. Detailed information about real estate listings held by brokerage firms other than CC&I Assoc. of REALTORS®, Inc. includes the name of the listing company. Neither the listing company nor CC&I Assoc. of REALTORS®, Inc. shall be responsible for any typographical errors, misinformation, misprints and shall be held totally harmless. The Broker providing this data believes it to be correct, but advises interested parties to confirm any item before relying on it in a purchase decision. All properties are subject to prior sale, changes, or withdrawal. Copyright 2026 © Cape Cod & Islands Multiple Listing Service, Inc. All rights reserved.
All data relating to real estate for sale on this page comes from the Broker Reciprocity (BR) of the Cape Cod & Islands Multiple Listing Service, Inc. Detailed information about real estate listings held by brokerage firms other than CC&I Assoc. of REALTORS®, Inc. includes the name of the listing company. Neither the listing company nor CC&I Assoc. of REALTORS®, Inc. shall be responsible for any typographical errors, misinformation, misprints and shall be held totally harmless. The Broker providing this data believes it to be correct, but advises interested parties to confirm any item before relying on it in a purchase decision. All properties are subject to prior sale, changes, or withdrawal. Copyright 2026 © Cape Cod & Islands Multiple Listing Service, Inc. All rights reserved.
Ask me questions while you tour the home.