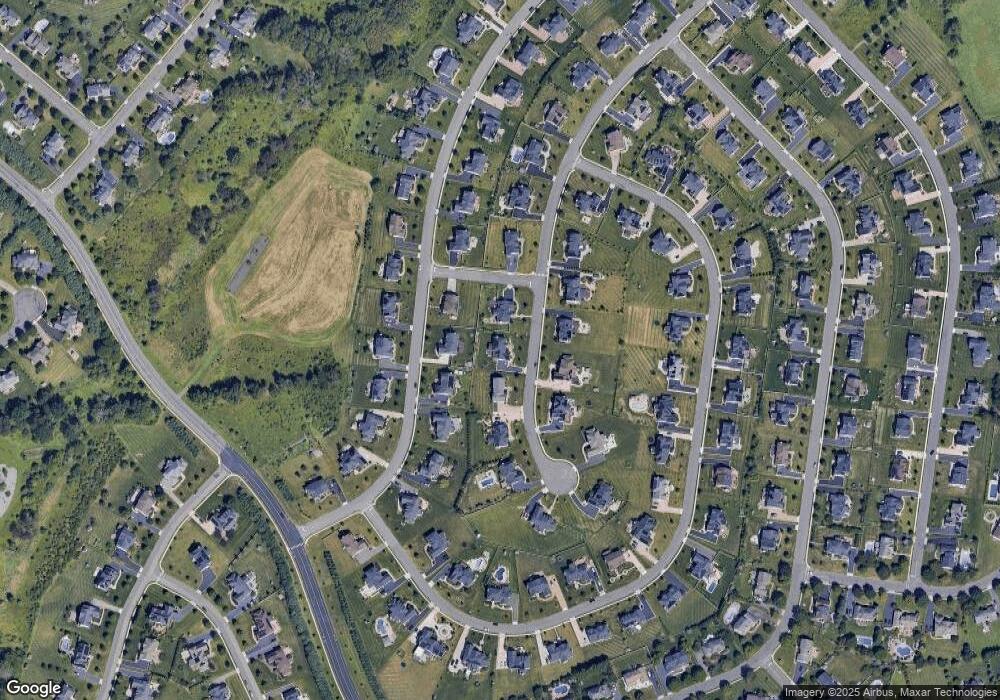
22 Bernart Ct Hillsborough, NJ 08844
Estimated Value: $1,247,000 - $1,279,000
--
Bed
--
Bath
3,244
Sq Ft
$389/Sq Ft
Est. Value
About This Home
This home is located at 22 Bernart Ct, Hillsborough, NJ 08844 and is currently estimated at $1,263,327, approximately $389 per square foot. 22 Bernart Ct is a home with nearby schools including Hillsborough High School.
Ownership History
Date
Name
Owned For
Owner Type
Purchase Details
Closed on
Nov 9, 2015
Sold by
Country Classics Iv Llc
Bought by
Balan Kumar Palanyapillai and Balan Suguna
Current Estimated Value
Home Financials for this Owner
Home Financials are based on the most recent Mortgage that was taken out on this home.
Original Mortgage
$550,000
Outstanding Balance
$426,331
Interest Rate
3.37%
Mortgage Type
Adjustable Rate Mortgage/ARM
Estimated Equity
$836,996
Create a Home Valuation Report for This Property
The Home Valuation Report is an in-depth analysis detailing your home's value as well as a comparison with similar homes in the area
Home Values in the Area
Average Home Value in this Area
Purchase History
| Date | Buyer | Sale Price | Title Company |
|---|---|---|---|
| Balan Kumar Palanyapillai | $787,747 | Classic Title Services |
Source: Public Records
Mortgage History
| Date | Status | Borrower | Loan Amount |
|---|---|---|---|
| Open | Balan Kumar Palanyapillai | $550,000 |
Source: Public Records
Tax History Compared to Growth
Tax History
| Year | Tax Paid | Tax Assessment Tax Assessment Total Assessment is a certain percentage of the fair market value that is determined by local assessors to be the total taxable value of land and additions on the property. | Land | Improvement |
|---|---|---|---|---|
| 2025 | $21,162 | $1,093,100 | $480,300 | $612,800 |
| 2024 | $21,162 | $987,500 | $415,300 | $572,200 |
| 2023 | $19,340 | $898,300 | $375,300 | $523,000 |
| 2022 | $19,222 | $860,800 | $385,300 | $475,500 |
| 2021 | $17,722 | $755,500 | $315,300 | $440,200 |
| 2020 | $17,415 | $730,500 | $290,300 | $440,200 |
| 2019 | $17,201 | $715,500 | $275,300 | $440,200 |
| 2018 | $16,703 | $690,500 | $250,300 | $440,200 |
| 2017 | $15,758 | $652,500 | $260,700 | $391,800 |
| 2016 | $6,293 | $260,700 | $260,700 | $0 |
| 2015 | $3,288 | $137,900 | $137,900 | $0 |
| 2014 | $3,219 | $137,900 | $137,900 | $0 |
Source: Public Records
Map
Nearby Homes