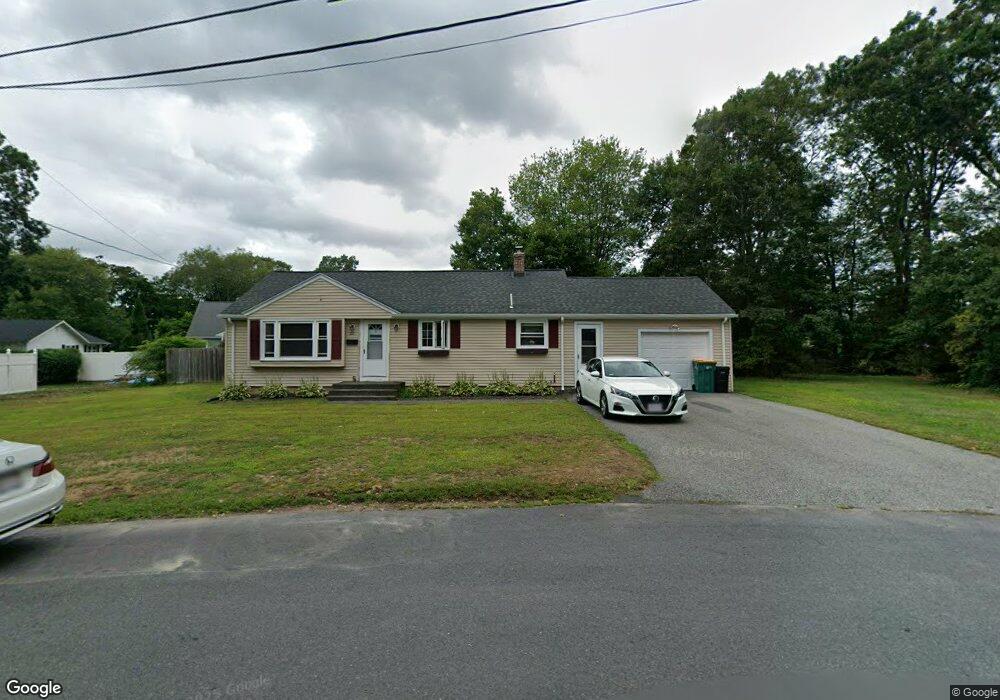
22 Bonneau St North Attleboro, MA 02760
North Attleboro NeighborhoodEstimated Value: $456,000 - $485,000
3
Beds
1
Bath
1,066
Sq Ft
$445/Sq Ft
Est. Value
About This Home
This home is located at 22 Bonneau St, North Attleboro, MA 02760 and is currently estimated at $474,185, approximately $444 per square foot. 22 Bonneau St is a home located in Bristol County with nearby schools including North Attleboro High School.
Ownership History
Date
Name
Owned For
Owner Type
Purchase Details
Closed on
Jun 28, 1996
Sold by
Drew Margaret B and Orr Barbara G
Bought by
Larkin Kathleen and Larkin John J
Current Estimated Value
Home Financials for this Owner
Home Financials are based on the most recent Mortgage that was taken out on this home.
Original Mortgage
$104,500
Outstanding Balance
$5,981
Interest Rate
8.05%
Mortgage Type
Purchase Money Mortgage
Estimated Equity
$468,204
Create a Home Valuation Report for This Property
The Home Valuation Report is an in-depth analysis detailing your home's value as well as a comparison with similar homes in the area
Home Values in the Area
Average Home Value in this Area
Purchase History
| Date | Buyer | Sale Price | Title Company |
|---|---|---|---|
| Larkin Kathleen | $110,000 | -- |
Source: Public Records
Mortgage History
| Date | Status | Borrower | Loan Amount |
|---|---|---|---|
| Open | Larkin Kathleen | $30,000 | |
| Open | Larkin Kathleen | $104,500 |
Source: Public Records
Tax History Compared to Growth
Tax History
| Year | Tax Paid | Tax Assessment Tax Assessment Total Assessment is a certain percentage of the fair market value that is determined by local assessors to be the total taxable value of land and additions on the property. | Land | Improvement |
|---|---|---|---|---|
| 2025 | $4,866 | $412,700 | $139,300 | $273,400 |
| 2024 | $4,653 | $403,200 | $139,300 | $263,900 |
| 2023 | $4,823 | $377,100 | $139,300 | $237,800 |
| 2022 | $4,662 | $334,700 | $139,300 | $195,400 |
| 2021 | $4,395 | $308,000 | $139,300 | $168,700 |
| 2020 | $4,283 | $298,500 | $139,300 | $159,200 |
| 2019 | $4,070 | $285,800 | $126,600 | $159,200 |
| 2018 | $3,632 | $272,300 | $126,600 | $145,700 |
| 2017 | $3,476 | $262,900 | $126,600 | $136,300 |
| 2016 | $3,207 | $242,600 | $140,700 | $101,900 |
| 2015 | $3,018 | $229,700 | $140,700 | $89,000 |
| 2014 | $2,783 | $210,200 | $123,500 | $86,700 |
Source: Public Records
Map
Nearby Homes
- 40 Roosevelt Ave
- 41 Roosevelt Ave
- 16 Johnson St
- 137 Sumner St
- 80 Broadway Unit 9
- 93 Bank St
- 23-R Eddy Street (Eddy St Rear)
- Lot 6 Sperry Ln
- 16 Richards Ave Unit 106
- 19 Church St Unit C9
- 17 Holbrook Ave
- 68 N Washington St Unit 210
- 130 E Washington St Unit 57
- 130 E Washington St Unit 71
- 300 E Washington St Unit 54R
- 300 E Washington St Unit 20N
- 36 Jefferson St
- 121 E Washington St Unit 8
- 121 E Washington St Unit 12
- 121 E Washington St Unit 13