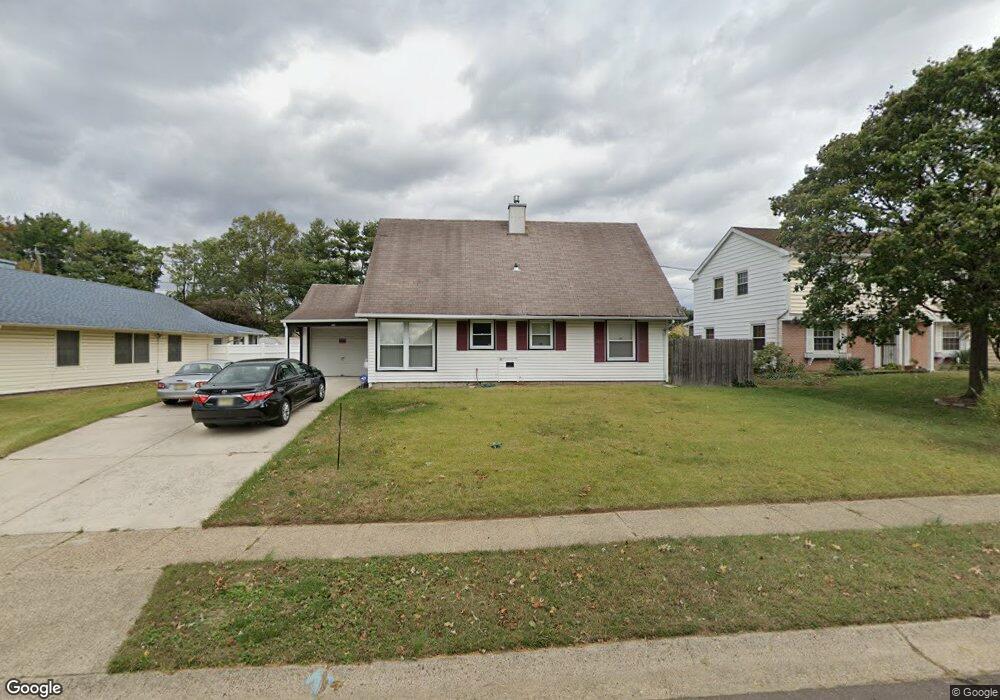
22 Bosworth Ln Willingboro, NJ 08046
Estimated Value: $329,767 - $361,000
4
Beds
2
Baths
1,624
Sq Ft
$211/Sq Ft
Est. Value
About This Home
This home is located at 22 Bosworth Ln, Willingboro, NJ 08046 and is currently estimated at $343,192, approximately $211 per square foot. 22 Bosworth Ln is a home located in Burlington County with nearby schools including Hawthorne Park Elementary School, Memorial Middle School, and Levitt Intermediate School.
Ownership History
Date
Name
Owned For
Owner Type
Purchase Details
Closed on
Aug 31, 1995
Sold by
The Salt & Light Company Inc
Bought by
Golden Robert and Golden Patricia
Current Estimated Value
Purchase Details
Closed on
Jun 6, 1995
Sold by
Nationscredit Financial Services Corp
Bought by
Salt & Light Company Inc
Purchase Details
Closed on
Jun 14, 1994
Sold by
Cummings Edward A
Bought by
Chrysler First Financial Services Corp
Create a Home Valuation Report for This Property
The Home Valuation Report is an in-depth analysis detailing your home's value as well as a comparison with similar homes in the area
Home Values in the Area
Average Home Value in this Area
Purchase History
| Date | Buyer | Sale Price | Title Company |
|---|---|---|---|
| Golden Robert | $80,450 | Congress Title Corp | |
| Salt & Light Company Inc | $51,000 | -- | |
| Chrysler First Financial Services Corp | $28,000 | -- |
Source: Public Records
Tax History Compared to Growth
Tax History
| Year | Tax Paid | Tax Assessment Tax Assessment Total Assessment is a certain percentage of the fair market value that is determined by local assessors to be the total taxable value of land and additions on the property. | Land | Improvement |
|---|---|---|---|---|
| 2025 | $5,526 | $128,000 | $32,000 | $96,000 |
| 2024 | $5,485 | $128,000 | $32,000 | $96,000 |
| 2023 | $5,485 | $128,000 | $32,000 | $96,000 |
| 2022 | $5,106 | $128,000 | $32,000 | $96,000 |
| 2021 | $4,463 | $128,000 | $32,000 | $96,000 |
| 2020 | $5,137 | $128,000 | $32,000 | $96,000 |
| 2019 | $5,088 | $128,000 | $32,000 | $96,000 |
| 2018 | $5,637 | $144,500 | $32,000 | $112,500 |
| 2017 | $5,229 | $144,500 | $32,000 | $112,500 |
| 2016 | $4,925 | $144,500 | $32,000 | $112,500 |
| 2015 | $4,738 | $144,500 | $32,000 | $112,500 |
| 2014 | $4,487 | $144,500 | $32,000 | $112,500 |
Source: Public Records
Map
Nearby Homes
- 4 Bancroft Ln
- 11 Buxmont Ln
- 71 Baldwin Ln
- 21 Berkshire Ln
- 6 Berkshire Ln
- 70 Buckingham Dr
- 22 Barrington Ln
- 39 Babcock Ln
- 30 Babcock Ln
- 44 Babcock Ln
- 17 Ballad Ln
- 26 Buttercup Ln
- 39 Babbitt Ln
- 69 Peregrine Way
- 14 Buttercup Ln
- 48 Hancock Ln
- 16 Bloomfield Ln
- 50 Hinsdale Ln
- 12 Bloomfield Ln
- 10 Bently Ln