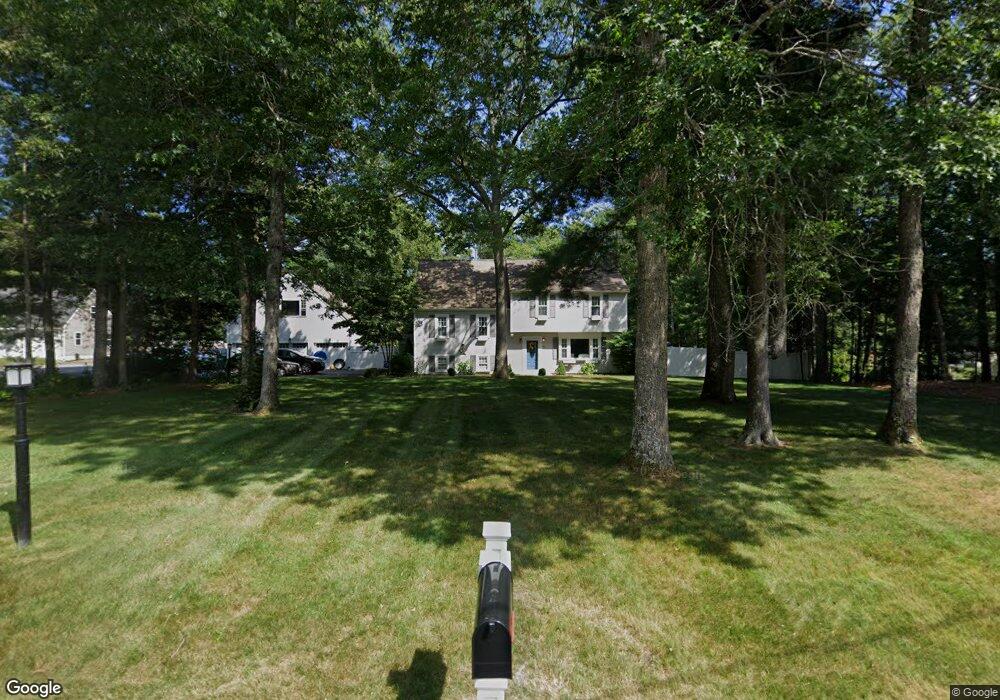
22 Bow St Carver, MA 02330
Estimated Value: $695,000 - $757,000
4
Beds
4
Baths
2,040
Sq Ft
$351/Sq Ft
Est. Value
About This Home
This home is located at 22 Bow St, Carver, MA 02330 and is currently estimated at $716,680, approximately $351 per square foot. 22 Bow St is a home located in Plymouth County with nearby schools including Carver Elementary School and Carver Middle/High School.
Ownership History
Date
Name
Owned For
Owner Type
Purchase Details
Closed on
Nov 30, 2022
Sold by
Umbrianna Thomas A and Umbrianna Nicole R
Bought by
Umbrianna Rt
Current Estimated Value
Purchase Details
Closed on
Jul 29, 2005
Sold by
Sugar Ray Realty Corp
Bought by
Umbrianna Thomas A and Umbrianna Nicole R
Home Financials for this Owner
Home Financials are based on the most recent Mortgage that was taken out on this home.
Original Mortgage
$375,000
Interest Rate
5.67%
Mortgage Type
Purchase Money Mortgage
Purchase Details
Closed on
Jan 21, 2005
Sold by
Galley William L and Galley Laurie A
Bought by
Sugar Ray Realty Corp
Home Financials for this Owner
Home Financials are based on the most recent Mortgage that was taken out on this home.
Original Mortgage
$329,896
Interest Rate
5.71%
Mortgage Type
Purchase Money Mortgage
Purchase Details
Closed on
Feb 13, 1998
Sold by
Andresen Roy and Green Linda A
Bought by
Galley William L
Create a Home Valuation Report for This Property
The Home Valuation Report is an in-depth analysis detailing your home's value as well as a comparison with similar homes in the area
Home Values in the Area
Average Home Value in this Area
Purchase History
| Date | Buyer | Sale Price | Title Company |
|---|---|---|---|
| Umbrianna Rt | -- | None Available | |
| Umbrianna Thomas A | $375,000 | -- | |
| Sugar Ray Realty Corp | $317,000 | -- | |
| Galley William L | $162,900 | -- |
Source: Public Records
Mortgage History
| Date | Status | Borrower | Loan Amount |
|---|---|---|---|
| Previous Owner | Galley William L | $375,000 | |
| Previous Owner | Galley William L | $329,896 |
Source: Public Records
Tax History
| Year | Tax Paid | Tax Assessment Tax Assessment Total Assessment is a certain percentage of the fair market value that is determined by local assessors to be the total taxable value of land and additions on the property. | Land | Improvement |
|---|---|---|---|---|
| 2025 | $8,658 | $624,200 | $142,100 | $482,100 |
| 2024 | $7,578 | $534,800 | $139,300 | $395,500 |
| 2023 | $7,368 | $505,000 | $139,300 | $365,700 |
| 2022 | $7,004 | $438,300 | $119,100 | $319,200 |
| 2021 | $6,986 | $412,400 | $106,300 | $306,100 |
| 2020 | $6,699 | $389,700 | $99,400 | $290,300 |
| 2019 | $4,948 | $365,600 | $96,500 | $269,100 |
| 2018 | $5,638 | $319,800 | $96,500 | $223,300 |
| 2017 | $4,740 | $304,800 | $92,800 | $212,000 |
| 2016 | $4,966 | $291,600 | $88,400 | $203,200 |
| 2015 | $4,623 | $271,800 | $88,400 | $183,400 |
| 2014 | $4,479 | $263,300 | $111,800 | $151,500 |
Source: Public Records
Map
Nearby Homes
- 58 Bunnys Rd
- 56 Bunnys Rd
- 13 Pond View Way
- 48 S Meadow Village
- 29 S Meadow Village
- 55 S Meadow Village
- 81 Center St
- 43 S Meadow Rd
- 89 Silva St
- 1 Pinehurst Dr
- 6 Twin Pines Ln Unit 6
- 9 Lawrence Rd
- 235 Main St
- 6 Deer Hill Ln
- 6 Coachman Terrace
- 2 Candlelight Dr
- 35 Silva St
- 19 Coachman Terrace
- 241 Carver Rd Unit 7
- 29 Wyndemere Ct
Your Personal Tour Guide
Ask me questions while you tour the home.