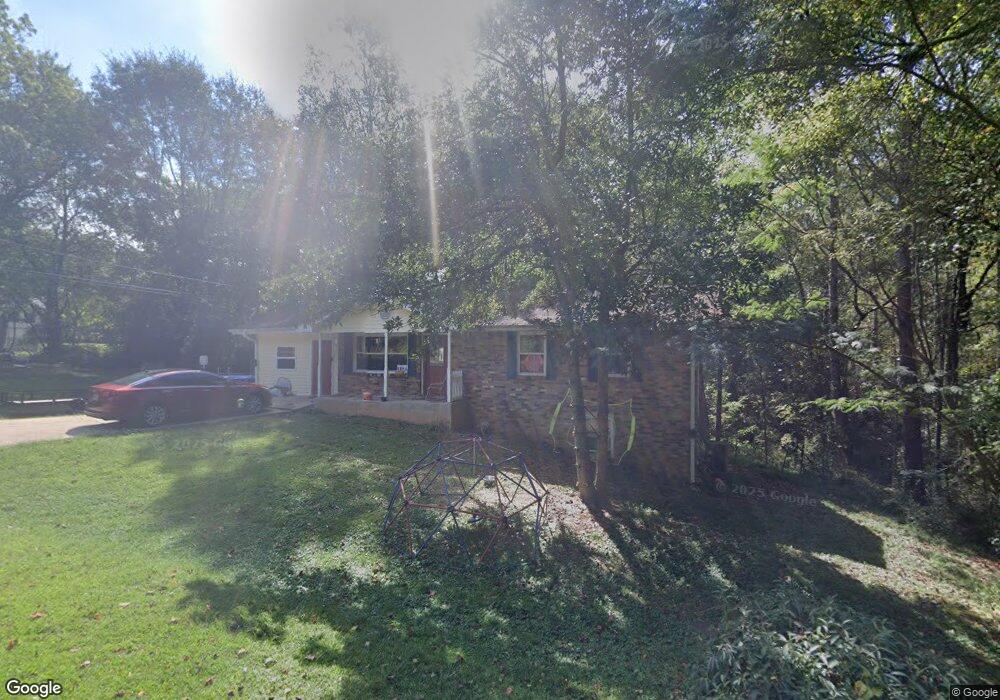
22 Bowen Dr Carrollton, GA 30117
Estimated Value: $203,000 - $238,000
3
Beds
1
Bath
1,000
Sq Ft
$219/Sq Ft
Est. Value
About This Home
This home is located at 22 Bowen Dr, Carrollton, GA 30117 and is currently estimated at $219,410, approximately $219 per square foot. 22 Bowen Dr is a home located in Carroll County with nearby schools including Mt. Zion Elementary School, Mt. Zion Middle School, and Mt. Zion High School.
Ownership History
Date
Name
Owned For
Owner Type
Purchase Details
Closed on
Dec 20, 2015
Sold by
Miller Janice
Bought by
Wilkins Kelly Alicia
Current Estimated Value
Purchase Details
Closed on
Sep 23, 2014
Sold by
Zeller Darcy
Bought by
Zeller Darcy and Miller Janice
Purchase Details
Closed on
Jun 19, 2009
Sold by
Federal National Mortgage Association
Bought by
Zeller Darcy
Purchase Details
Closed on
Apr 7, 2009
Sold by
Citimortgage Inc
Bought by
Federal National Mtg Associati
Purchase Details
Closed on
Jan 17, 2003
Sold by
Secretary Of Hud
Bought by
Moss Tabitha M
Purchase Details
Closed on
Feb 5, 2002
Sold by
Citimortgage Inc
Bought by
Secretary Of Hud
Purchase Details
Closed on
Dec 14, 1998
Sold by
Wilkerson Sharon C
Bought by
Wilkerson Carlos
Purchase Details
Closed on
Oct 9, 1998
Sold by
Winters Wade and Winters Joyce
Bought by
Dunson Vannessa S
Purchase Details
Closed on
Sep 21, 1976
Bought by
Winters
Create a Home Valuation Report for This Property
The Home Valuation Report is an in-depth analysis detailing your home's value as well as a comparison with similar homes in the area
Home Values in the Area
Average Home Value in this Area
Purchase History
| Date | Buyer | Sale Price | Title Company |
|---|---|---|---|
| Wilkins Kelly Alicia | $84,000 | -- | |
| Zeller Darcy | -- | -- | |
| Zeller Darcy | $28,000 | -- | |
| Federal National Mtg Associati | -- | -- | |
| Citimortgage Inc | $42,245 | -- | |
| Moss Tabitha M | -- | -- | |
| Secretary Of Hud | $69,500 | -- | |
| Citimortgage Inc | $69,500 | -- | |
| Mortgage Elect | $69,500 | -- | |
| Wilkerson Carlos | -- | -- | |
| Wilkerson Sharon C | $61,000 | -- | |
| Dunson Vannessa S | $35,000 | -- | |
| Winters | -- | -- |
Source: Public Records
Tax History Compared to Growth
Tax History
| Year | Tax Paid | Tax Assessment Tax Assessment Total Assessment is a certain percentage of the fair market value that is determined by local assessors to be the total taxable value of land and additions on the property. | Land | Improvement |
|---|---|---|---|---|
| 2024 | $1,669 | $77,770 | $8,156 | $69,614 |
| 2023 | $1,669 | $69,995 | $6,525 | $63,470 |
| 2022 | $1,341 | $53,452 | $2,475 | $50,977 |
| 2021 | $1,175 | $45,814 | $1,980 | $43,834 |
| 2020 | $1,050 | $40,890 | $1,800 | $39,090 |
| 2019 | $983 | $37,995 | $1,800 | $36,195 |
| 2018 | $784 | $29,846 | $360 | $29,486 |
| 2017 | $803 | $30,486 | $1,000 | $29,486 |
| 2016 | $803 | $30,486 | $1,000 | $29,486 |
| 2015 | $704 | $29,173 | $4,000 | $25,174 |
| 2014 | $707 | $29,174 | $4,000 | $25,174 |
Source: Public Records
Map
Nearby Homes
- 676 Hog Liver Rd
- 00 Hog Liver Rd Unit 346
- 0 Hog Liver Rd Unit 148331
- 0 Hog Liver Rd Unit 10630257
- 0 Hog Liver Rd Unit 7671087
- 0 Hog Liver Rd Unit 10614601
- 0 Hog Liver Rd Unit 10630818
- 266 Lambert Overlook Cir
- The Thomas 2 Plan at Lambert Overlook
- The Thomas Plan at Lambert Overlook
- The Brook Plan at Lambert Overlook
- 0 Hwy 27 N
- 14 Cole Lake Rd
- 2990 N Highway 27
- 174 Katie Ln
- 77 Little River Rd
- 898 Bowdon Junction Rd
- 68 Tyler Ln
- 142 Tyler Ln
- 50 Green Acres Dr
- 4 Bowen Dr
- 1394 Bear Creek Rd
- 79 Bowen Dr
- 0 Bowen Dr Unit 9018087
- 0 Bowen Dr Unit 9070111
- 0 Bowen Dr Unit 8514477
- 0 Bowen Dr Unit 8631118
- 0 Bowen Dr
- 18 E Eli Dr
- 774 Hog Liver Rd
- 26 E Eli Dr
- 38 E Eli Dr
- 61 Bowen Dr
- 15 E Eli Dr
- E E Eli Dr Unit 10
- E E Eli Dr
- 31 E Eli Dr
- 36 E Eli Dr
- 1354 Bear Creek Rd
- 41 E Eli Dr