Estimated Value: $147,000 - $193,000
--
Bed
--
Bath
1,314
Sq Ft
$129/Sq Ft
Est. Value
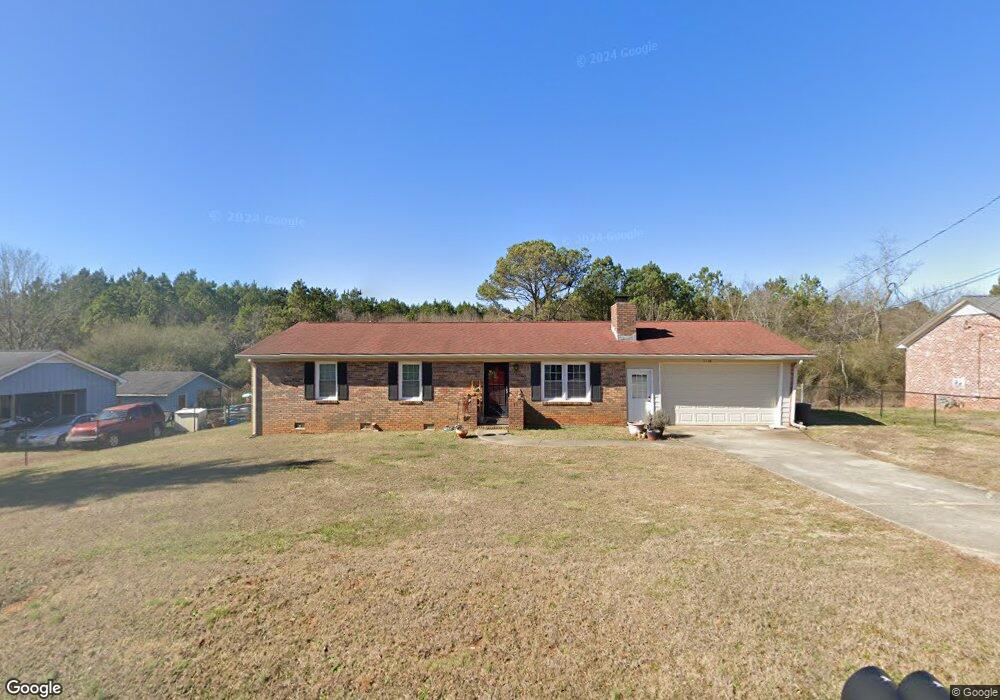
About This Home
This home is located at 22 Boyd Valley Rd SE, Rome, GA 30161 and is currently estimated at $168,872, approximately $128 per square foot. 22 Boyd Valley Rd SE is a home located in Floyd County with nearby schools including Pepperell Middle School, Pepperell High School, and Montessori School of Rome.
Ownership History
Date
Name
Owned For
Owner Type
Purchase Details
Closed on
Sep 28, 2018
Sold by
Clark Eddy Raymond
Bought by
Burchett John R
Current Estimated Value
Home Financials for this Owner
Home Financials are based on the most recent Mortgage that was taken out on this home.
Original Mortgage
$48,000
Outstanding Balance
$41,859
Interest Rate
4.5%
Mortgage Type
New Conventional
Estimated Equity
$127,013
Purchase Details
Closed on
Jun 17, 2017
Sold by
Clark Liliana
Bought by
Clark Eddy Raymond
Purchase Details
Closed on
Jun 6, 2017
Sold by
Clark Thomas B
Bought by
Clark Liliana
Purchase Details
Closed on
Oct 23, 1973
Sold by
Blalock Ross
Bought by
Clark Thomas B
Purchase Details
Closed on
Nov 10, 1970
Sold by
Davis Clyde R and Davis Sara R
Bought by
Blalock Ross
Purchase Details
Closed on
Dec 31, 1965
Bought by
Davis Clyde R and Davis Sara R
Create a Home Valuation Report for This Property
The Home Valuation Report is an in-depth analysis detailing your home's value as well as a comparison with similar homes in the area
Home Values in the Area
Average Home Value in this Area
Purchase History
| Date | Buyer | Sale Price | Title Company |
|---|---|---|---|
| Burchett John R | $60,000 | -- | |
| Clark Eddy Raymond | -- | -- | |
| Clark Liliana | -- | -- | |
| Clark Thomas B | $38,000 | -- | |
| Blalock Ross | $20,000 | -- | |
| Davis Clyde R | -- | -- |
Source: Public Records
Mortgage History
| Date | Status | Borrower | Loan Amount |
|---|---|---|---|
| Open | Burchett John R | $48,000 |
Source: Public Records
Tax History Compared to Growth
Tax History
| Year | Tax Paid | Tax Assessment Tax Assessment Total Assessment is a certain percentage of the fair market value that is determined by local assessors to be the total taxable value of land and additions on the property. | Land | Improvement |
|---|---|---|---|---|
| 2024 | $1,898 | $61,486 | $4,198 | $57,288 |
| 2023 | $1,759 | $48,879 | $3,816 | $45,063 |
| 2022 | $1,213 | $40,876 | $2,968 | $37,908 |
| 2021 | $1,052 | $34,860 | $2,968 | $31,892 |
| 2020 | $866 | $28,437 | $2,120 | $26,317 |
| 2019 | $721 | $27,452 | $2,120 | $25,332 |
| 2018 | $850 | $28,266 | $2,120 | $26,146 |
| 2017 | $253 | $27,733 | $2,120 | $25,613 |
| 2016 | $256 | $26,696 | $2,120 | $24,576 |
| 2015 | $238 | $26,696 | $2,120 | $24,576 |
| 2014 | $238 | $26,696 | $2,120 | $24,576 |
Source: Public Records
Map
Nearby Homes
- Greenbriar Plan at Three Rivers - Maple Street Collection
- Jensen Plan at Three Rivers - Maple Street Collection
- Yosemite Plan at Three Rivers - Maple Street Collection
- Danville Plan at Three Rivers - Maple Street Collection
- Breckenridge Plan at Three Rivers - Maple Street Collection
- Beacon Plan at Three Rivers - Maple Street Collection
- Wesley Plan at Three Rivers - Maple Street Collection
- DaVinci Plan at Three Rivers - Maple Street Collection
- Yosemite Plan at Cherry Glen - Maple Street Collection
- Jensen Plan at Cherry Glen - Maple Street Collection
- Breckenridge Plan at Cherry Glen - Maple Street Collection
- Greenbriar Plan at Cherry Glen - Maple Street Collection
- Wesley Plan at Cherry Glen - Maple Street Collection
- DaVinci Plan at Cherry Glen - Maple Street Collection
- Beacon Plan at Cherry Glen - Maple Street Collection
- 30 Rushden Way SE
- 28 Rushden Way SE
- 7 Shirley Ln SE
- 7 Rushden Way SE
- 3 Rushden Way SE
- 34 Boyd Valley Rd SE
- 38 Boyd Valley Rd SE
- 1262 Chulio Rd SE
- 11 Boyd Valley Rd SE
- 60 Chulio Rd SE
- 21 Boyd Valley Rd SE
- 33 Boyd Valley Rd SE
- 1258 Chulio Rd SE
- 1278 Chulio Rd SE
- 0 Boyd Valley Rd SE Unit 8949612
- 0 Boyd Valley Rd SE Unit 9050911
- 0 Boyd Valley Rd SE Unit 8938238
- 0 Boyd Valley Rd SE Unit 3159110
- 0 Boyd Valley Rd SE Unit 7429307
- 0 Boyd Valley Rd SE Unit 7477719
- 0 Boyd Valley Rd SE Unit 7481753
- 0 Boyd Valley Rd SE Unit 8161642
- 0 Boyd Valley Rd SE Unit 8229949
- 0 Boyd Valley Rd SE Unit 8313620
- 0 Boyd Valley Rd SE Unit 8622091