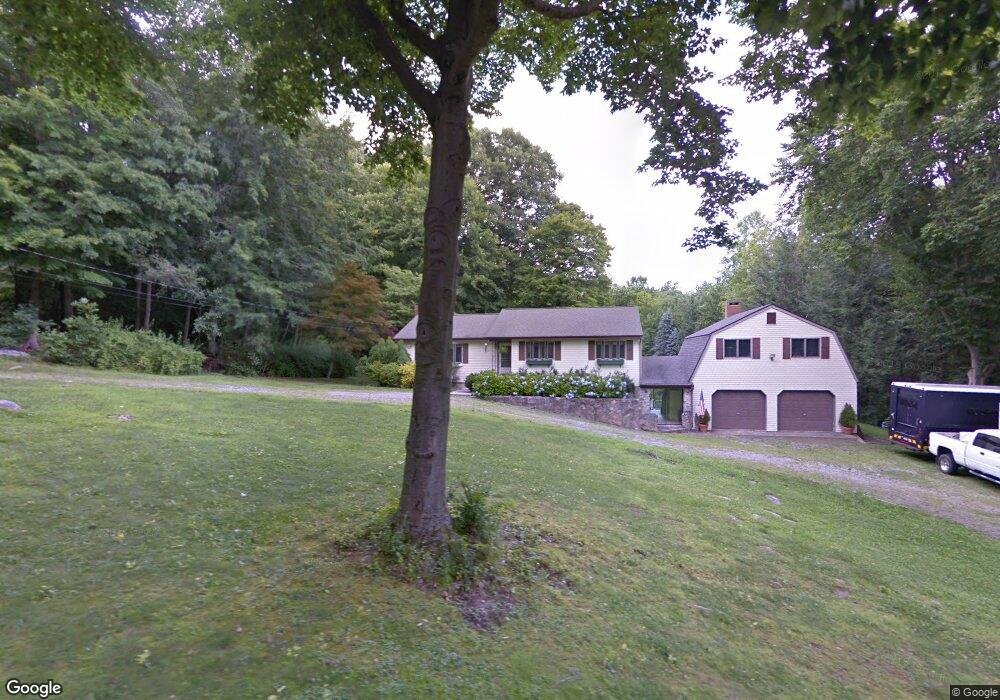
22 Bradley Ln Sandy Hook, CT 06482
Estimated Value: $547,757 - $673,000
3
Beds
3
Baths
1,296
Sq Ft
$465/Sq Ft
Est. Value
About This Home
This home is located at 22 Bradley Ln, Sandy Hook, CT 06482 and is currently estimated at $602,439, approximately $464 per square foot. 22 Bradley Ln is a home located in Fairfield County with nearby schools including Sandy Hook Elementary School, Reed Intermediate School, and Newtown Middle School.
Ownership History
Date
Name
Owned For
Owner Type
Purchase Details
Closed on
Dec 8, 2003
Sold by
Carpenter Barrie
Bought by
Genovese Michael and Genovese Joanne
Current Estimated Value
Home Financials for this Owner
Home Financials are based on the most recent Mortgage that was taken out on this home.
Original Mortgage
$180,000
Outstanding Balance
$84,282
Interest Rate
6.03%
Estimated Equity
$518,157
Purchase Details
Closed on
Jun 30, 2000
Sold by
Paltauf Richard T
Bought by
Starges Barrie
Home Financials for this Owner
Home Financials are based on the most recent Mortgage that was taken out on this home.
Original Mortgage
$80,000
Interest Rate
8.59%
Purchase Details
Closed on
Jan 18, 1994
Sold by
Graham Alaln and Graham Cora
Bought by
Paltauf Richard
Create a Home Valuation Report for This Property
The Home Valuation Report is an in-depth analysis detailing your home's value as well as a comparison with similar homes in the area
Home Values in the Area
Average Home Value in this Area
Purchase History
| Date | Buyer | Sale Price | Title Company |
|---|---|---|---|
| Genovese Michael | $395,000 | -- | |
| Genovese Michael | $395,000 | -- | |
| Starges Barrie | $288,000 | -- | |
| Starges Barrie | $288,000 | -- | |
| Paltauf Richard | $206,500 | -- | |
| Paltauf Richard | $206,500 | -- |
Source: Public Records
Mortgage History
| Date | Status | Borrower | Loan Amount |
|---|---|---|---|
| Open | Paltauf Richard | $180,000 | |
| Closed | Paltauf Richard | $180,000 | |
| Previous Owner | Paltauf Richard | $80,000 |
Source: Public Records
Tax History
| Year | Tax Paid | Tax Assessment Tax Assessment Total Assessment is a certain percentage of the fair market value that is determined by local assessors to be the total taxable value of land and additions on the property. | Land | Improvement |
|---|---|---|---|---|
| 2025 | $9,103 | $316,720 | $90,740 | $225,980 |
| 2024 | $8,542 | $316,720 | $90,740 | $225,980 |
| 2023 | $8,311 | $316,720 | $90,740 | $225,980 |
| 2022 | $7,495 | $216,180 | $79,480 | $136,700 |
| 2021 | $7,491 | $216,180 | $79,480 | $136,700 |
| 2020 | $7,514 | $216,180 | $79,480 | $136,700 |
| 2019 | $7,517 | $216,180 | $79,480 | $136,700 |
| 2018 | $7,898 | $230,660 | $79,480 | $151,180 |
| 2017 | $6,582 | $194,340 | $84,680 | $109,660 |
| 2016 | $6,530 | $194,340 | $84,680 | $109,660 |
| 2015 | $6,427 | $194,340 | $84,680 | $109,660 |
| 2014 | $6,473 | $194,340 | $84,680 | $109,660 |
Source: Public Records
Map
Nearby Homes
- 3 Serenity Ln
- 39 Bradley Ln
- 8 Stone Bridge Trail
- 13 Jordan Hill Rd Unit Lot 4
- 59 Great Ring Rd
- 49 Great Ring Rd
- 238 Berkshire Rd
- 40 Great Ring Rd
- 42 Great Ring Rd
- 124 Bagburn Rd
- 34 Bagburn Rd
- 275 Hammertown Rd
- 56 Downs Rd
- 40 Osborne Hill Rd
- 24 Legacy Ln
- 15 Legacy Ln
- 3 Rowledge Pond Rd
- 360 Garder Rd
- 66 Marlin Rd
- 491 Hammertown Rd
Your Personal Tour Guide
Ask me questions while you tour the home.