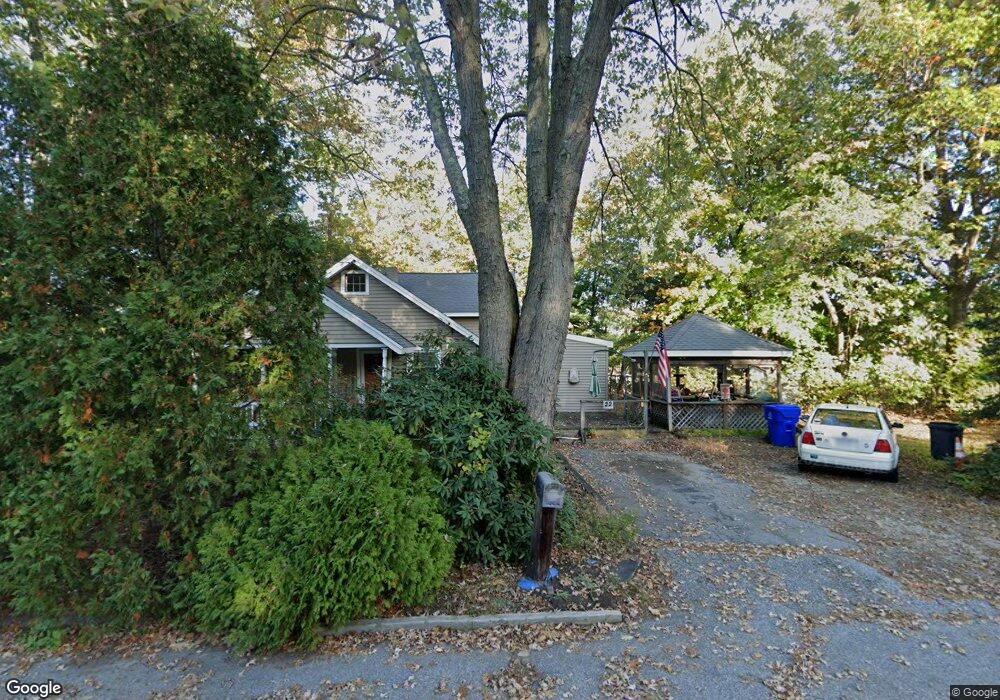
22 Brayman St Auburn, MA 01501
Stoneville NeighborhoodEstimated Value: $417,000 - $442,000
4
Beds
2
Baths
1,490
Sq Ft
$287/Sq Ft
Est. Value
About This Home
This home is located at 22 Brayman St, Auburn, MA 01501 and is currently estimated at $427,278, approximately $286 per square foot. 22 Brayman St is a home located in Worcester County with nearby schools including Auburn Senior High School and Shrewsbury Montessori School - Auburn Campus.
Ownership History
Date
Name
Owned For
Owner Type
Purchase Details
Closed on
Oct 24, 2006
Sold by
Bylund Bette A and Elia Bette A
Bought by
Elia Bette A
Current Estimated Value
Home Financials for this Owner
Home Financials are based on the most recent Mortgage that was taken out on this home.
Original Mortgage
$315,000
Outstanding Balance
$188,278
Interest Rate
6.49%
Mortgage Type
Purchase Money Mortgage
Estimated Equity
$239,000
Create a Home Valuation Report for This Property
The Home Valuation Report is an in-depth analysis detailing your home's value as well as a comparison with similar homes in the area
Home Values in the Area
Average Home Value in this Area
Purchase History
| Date | Buyer | Sale Price | Title Company |
|---|---|---|---|
| Elia Bette A | -- | -- |
Source: Public Records
Mortgage History
| Date | Status | Borrower | Loan Amount |
|---|---|---|---|
| Open | Elia Bette A | $315,000 |
Source: Public Records
Tax History Compared to Growth
Tax History
| Year | Tax Paid | Tax Assessment Tax Assessment Total Assessment is a certain percentage of the fair market value that is determined by local assessors to be the total taxable value of land and additions on the property. | Land | Improvement |
|---|---|---|---|---|
| 2025 | $46 | $320,300 | $126,900 | $193,400 |
| 2024 | $4,582 | $306,900 | $121,200 | $185,700 |
| 2023 | $4,534 | $285,500 | $110,200 | $175,300 |
| 2022 | $4,210 | $250,300 | $110,200 | $140,100 |
| 2021 | $2,389 | $207,600 | $97,300 | $110,300 |
| 2020 | $3,711 | $206,400 | $97,300 | $109,100 |
| 2019 | $3,570 | $193,800 | $96,300 | $97,500 |
| 2018 | $3,365 | $182,500 | $90,100 | $92,400 |
| 2017 | $3,147 | $171,600 | $81,700 | $89,900 |
| 2016 | $3,014 | $166,600 | $85,300 | $81,300 |
| 2015 | $2,834 | $164,200 | $85,300 | $78,900 |
| 2014 | $2,844 | $164,500 | $81,200 | $83,300 |
Source: Public Records
Map
Nearby Homes