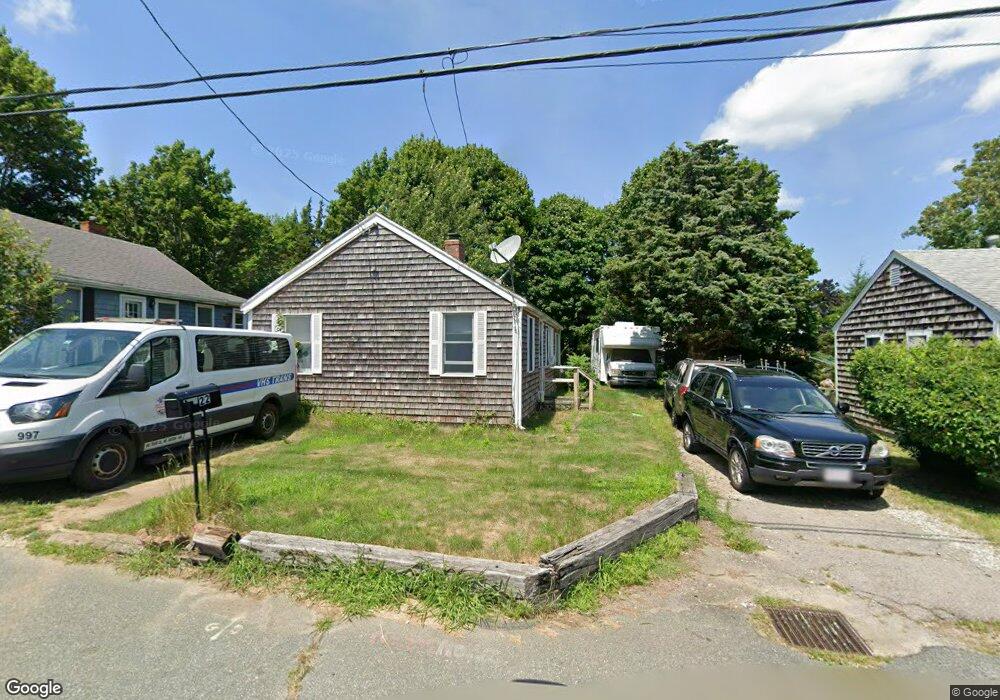
22 Brunswick St Marshfield, MA 02050
Ocean Bluff-Brant Rock NeighborhoodEstimated Value: $338,000 - $499,000
2
Beds
1
Bath
780
Sq Ft
$569/Sq Ft
Est. Value
About This Home
This home is located at 22 Brunswick St, Marshfield, MA 02050 and is currently estimated at $444,146, approximately $569 per square foot. 22 Brunswick St is a home located in Plymouth County with nearby schools including Daniel Webster, Furnace Brook Middle School, and Marshfield High School.
Ownership History
Date
Name
Owned For
Owner Type
Purchase Details
Closed on
Mar 30, 2016
Sold by
Hogan Carol
Bought by
Johnson Henry L
Current Estimated Value
Home Financials for this Owner
Home Financials are based on the most recent Mortgage that was taken out on this home.
Original Mortgage
$137,300
Outstanding Balance
$108,375
Interest Rate
3.65%
Mortgage Type
New Conventional
Estimated Equity
$335,771
Purchase Details
Closed on
Apr 9, 2010
Sold by
Burton Jean F and Packer Kenneth A
Bought by
Hogan Carol
Home Financials for this Owner
Home Financials are based on the most recent Mortgage that was taken out on this home.
Original Mortgage
$100,100
Interest Rate
5.12%
Mortgage Type
Purchase Money Mortgage
Purchase Details
Closed on
Aug 12, 2003
Sold by
F J
Bought by
Burton Jean F and Packer Kenneth A
Create a Home Valuation Report for This Property
The Home Valuation Report is an in-depth analysis detailing your home's value as well as a comparison with similar homes in the area
Home Values in the Area
Average Home Value in this Area
Purchase History
| Date | Buyer | Sale Price | Title Company |
|---|---|---|---|
| Johnson Henry L | $144,577 | -- | |
| Hogan Carol | $190,000 | -- | |
| Hogan Carol | $190,000 | -- | |
| Burton Jean F | -- | -- | |
| Burton Jean F | -- | -- |
Source: Public Records
Mortgage History
| Date | Status | Borrower | Loan Amount |
|---|---|---|---|
| Open | Johnson Henry L | $137,300 | |
| Closed | Burton Jean F | $137,300 | |
| Previous Owner | Hogan Carol | $100,100 |
Source: Public Records
Tax History Compared to Growth
Tax History
| Year | Tax Paid | Tax Assessment Tax Assessment Total Assessment is a certain percentage of the fair market value that is determined by local assessors to be the total taxable value of land and additions on the property. | Land | Improvement |
|---|---|---|---|---|
| 2025 | $2,210 | $223,200 | $144,500 | $78,700 |
| 2024 | $2,325 | $223,800 | $145,100 | $78,700 |
| 2023 | $2,310 | $210,200 | $145,100 | $65,100 |
| 2022 | $2,310 | $178,400 | $113,300 | $65,100 |
| 2021 | $2,241 | $169,900 | $109,050 | $60,850 |
| 2020 | $2,154 | $161,600 | $104,900 | $56,700 |
| 2019 | $2,074 | $155,000 | $103,300 | $51,700 |
| 2018 | $1,967 | $147,100 | $99,300 | $47,800 |
| 2017 | $1,985 | $144,700 | $98,300 | $46,400 |
| 2016 | $1,918 | $138,200 | $94,800 | $43,400 |
| 2015 | $1,837 | $138,200 | $94,800 | $43,400 |
| 2014 | $1,843 | $138,700 | $95,300 | $43,400 |
Source: Public Records
Map
Nearby Homes