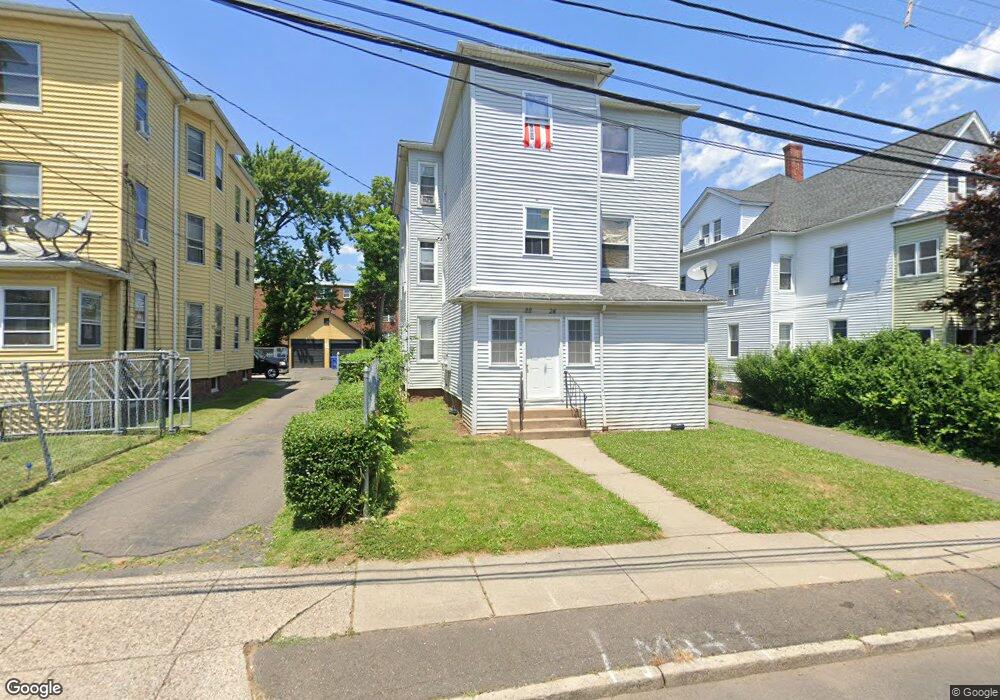
22 Bushnell St Unit 24 Hartford, CT 06114
South End NeighborhoodEstimated Value: $425,000 - $488,100
6
Beds
3
Baths
3,324
Sq Ft
$139/Sq Ft
Est. Value
About This Home
This home is located at 22 Bushnell St Unit 24, Hartford, CT 06114 and is currently estimated at $463,525, approximately $139 per square foot. 22 Bushnell St Unit 24 is a home located in Hartford County with nearby schools including Asian Studies School At Dwight/Belizzi School, Dr. James H Naylor/Ccsu Leadership Academy, and M. D. Fox School.
Ownership History
Date
Name
Owned For
Owner Type
Purchase Details
Closed on
Apr 18, 2024
Sold by
Rm Realty Llc Ii
Bought by
Bromell Gareth
Current Estimated Value
Home Financials for this Owner
Home Financials are based on the most recent Mortgage that was taken out on this home.
Original Mortgage
$373,500
Outstanding Balance
$367,574
Interest Rate
6.88%
Mortgage Type
Purchase Money Mortgage
Estimated Equity
$95,951
Purchase Details
Closed on
Oct 24, 2012
Sold by
Mozzicato Rino
Bought by
Rm Realty Llc 2
Purchase Details
Closed on
Dec 9, 1987
Sold by
Ciccarelli Marie
Bought by
Bongiovanni Giuseppe
Home Financials for this Owner
Home Financials are based on the most recent Mortgage that was taken out on this home.
Original Mortgage
$157,500
Interest Rate
10.96%
Mortgage Type
Purchase Money Mortgage
Create a Home Valuation Report for This Property
The Home Valuation Report is an in-depth analysis detailing your home's value as well as a comparison with similar homes in the area
Home Values in the Area
Average Home Value in this Area
Purchase History
| Date | Buyer | Sale Price | Title Company |
|---|---|---|---|
| Bromell Gareth | $415,000 | None Available | |
| Bromell Gareth | $415,000 | None Available | |
| Rm Realty Llc 2 | -- | -- | |
| Rm Realty Llc 2 | -- | -- | |
| Bongiovanni Giuseppe | $210,000 | -- |
Source: Public Records
Mortgage History
| Date | Status | Borrower | Loan Amount |
|---|---|---|---|
| Open | Bromell Gareth | $373,500 | |
| Closed | Bromell Gareth | $373,500 | |
| Previous Owner | Bongiovanni Giuseppe | $120,000 | |
| Previous Owner | Bongiovanni Giuseppe | $71,920 | |
| Previous Owner | Bongiovanni Giuseppe | $157,500 |
Source: Public Records
Tax History Compared to Growth
Tax History
| Year | Tax Paid | Tax Assessment Tax Assessment Total Assessment is a certain percentage of the fair market value that is determined by local assessors to be the total taxable value of land and additions on the property. | Land | Improvement |
|---|---|---|---|---|
| 2025 | $7,227 | $104,811 | $9,371 | $95,440 |
| 2024 | $7,227 | $104,811 | $9,371 | $95,440 |
| 2023 | $7,227 | $104,811 | $9,371 | $95,440 |
| 2022 | $7,227 | $104,811 | $9,371 | $95,440 |
| 2021 | $5,291 | $71,225 | $12,425 | $58,800 |
| 2020 | $5,291 | $71,225 | $12,425 | $58,800 |
| 2019 | $5,291 | $71,225 | $12,425 | $58,800 |
| 2018 | $5,113 | $68,824 | $12,006 | $56,818 |
| 2016 | $4,008 | $53,952 | $11,435 | $42,517 |
| 2015 | $3,818 | $51,389 | $10,891 | $40,498 |
| 2014 | $3,724 | $50,133 | $10,625 | $39,508 |
Source: Public Records
Map
Nearby Homes
- 147 Preston St Unit 1
- 61 Preston St Unit 63
- 183 Preston St Unit 185
- 152 Otis St
- 497 Wethersfield Ave
- 26 Barker St Unit 28
- 213 Franklin Ave Unit 405
- 17 Bond St
- 21 Wayland St
- 15 Bond St
- 10 Warner St
- 49 Benton St
- 35 Clifford St
- 69 Mountford St Unit 3A
- 73 Mountford St Unit 3B
- 159 Gilman St
- 114 Shultas Place Unit 116
- 30 Shultas Place Unit 32
- 3 Pawtucket St
- 308 Brown St
- 22-24 Bushnell St
- 26 Bushnell St Unit 28
- 26-28 Bushnell St
- 26 Bushnell St Unit 3rd fl
- 26 Bushnell St Unit 1
- 30 Bushnell St
- 18 Bushnell St Unit 20
- 34 Bushnell St Unit 36
- 109 Adelaide St Unit C6
- 109 Adelaide St
- 21 Bushnell St Unit 23
- 19 Bushnell St
- 31 Bushnell St Unit 33
- 25 Bushnell St Unit 27
- 25 Bushnell St Unit 1stfl
- 42 Bushnell St Unit 44
- 38 Bushnell St Unit 40
- 101 Adelaide St Unit 103
- 119 Adelaide St
- 321 Franklin Ave Unit 323