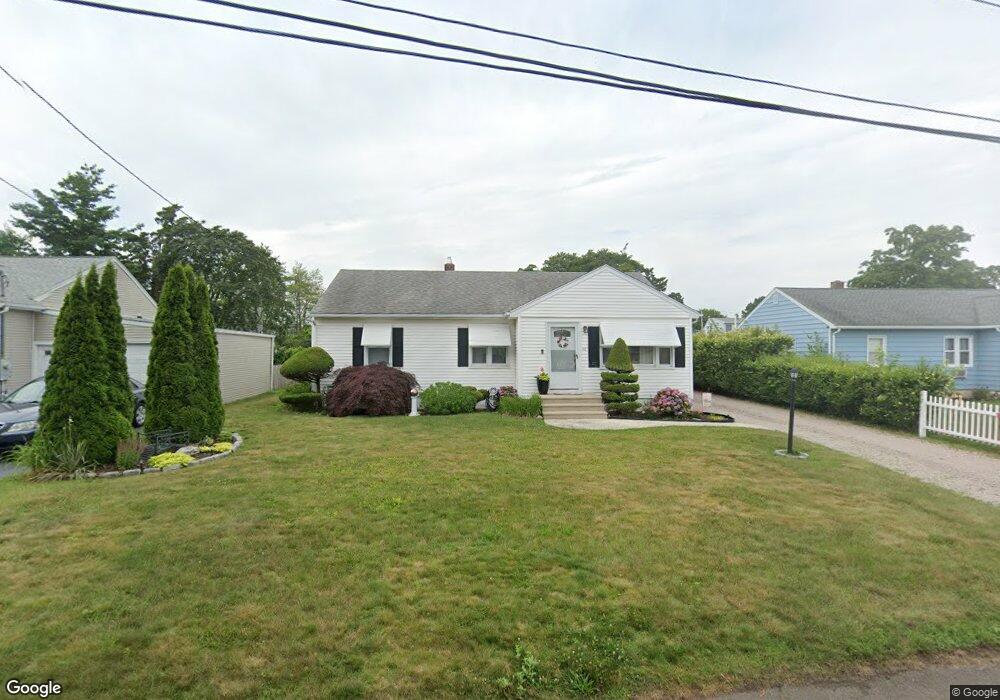
22 Canna Dr East Haven, CT 06512
Estimated Value: $366,000 - $390,000
2
Beds
2
Baths
1,032
Sq Ft
$369/Sq Ft
Est. Value
About This Home
This home is located at 22 Canna Dr, East Haven, CT 06512 and is currently estimated at $381,175, approximately $369 per square foot. 22 Canna Dr is a home located in New Haven County with nearby schools including East Haven High School and Pathway School.
Ownership History
Date
Name
Owned For
Owner Type
Purchase Details
Closed on
Aug 16, 2021
Sold by
Gambardella Elizabeth
Bought by
Gambardella Elizabeth and Gabardella Elizabeth A
Current Estimated Value
Home Financials for this Owner
Home Financials are based on the most recent Mortgage that was taken out on this home.
Original Mortgage
$131,500
Outstanding Balance
$99,883
Interest Rate
2.2%
Mortgage Type
Stand Alone Refi Refinance Of Original Loan
Estimated Equity
$281,292
Purchase Details
Closed on
Jun 29, 1989
Sold by
Vitelli Virginia
Bought by
Gambardella John
Create a Home Valuation Report for This Property
The Home Valuation Report is an in-depth analysis detailing your home's value as well as a comparison with similar homes in the area
Home Values in the Area
Average Home Value in this Area
Purchase History
| Date | Buyer | Sale Price | Title Company |
|---|---|---|---|
| Gambardella Elizabeth | -- | None Available | |
| Gambardella Elizabeth | -- | None Available | |
| Gambardella John | $160,000 | -- |
Source: Public Records
Mortgage History
| Date | Status | Borrower | Loan Amount |
|---|---|---|---|
| Open | Gambardella Elizabeth | $131,500 | |
| Previous Owner | Gambardella John | $137,500 | |
| Previous Owner | Gambardella John | $155,000 | |
| Previous Owner | Gambardella John | $16,000 | |
| Previous Owner | Gambardella John | $124,200 |
Source: Public Records
Tax History
| Year | Tax Paid | Tax Assessment Tax Assessment Total Assessment is a certain percentage of the fair market value that is determined by local assessors to be the total taxable value of land and additions on the property. | Land | Improvement |
|---|---|---|---|---|
| 2025 | $5,632 | $168,420 | $56,910 | $111,510 |
| 2024 | $5,632 | $168,420 | $56,910 | $111,510 |
| 2023 | $5,255 | $168,420 | $56,910 | $111,510 |
| 2022 | $5,255 | $168,420 | $56,910 | $111,510 |
| 2021 | $4,769 | $139,250 | $50,570 | $88,680 |
| 2020 | $4,769 | $139,250 | $50,570 | $88,680 |
| 2019 | $4,514 | $139,250 | $50,570 | $88,680 |
| 2018 | $4,519 | $139,250 | $50,570 | $88,680 |
| 2017 | $4,393 | $139,250 | $50,570 | $88,680 |
| 2016 | $4,262 | $135,080 | $50,560 | $84,520 |
| 2015 | $4,262 | $135,080 | $50,560 | $84,520 |
| 2014 | $4,329 | $135,080 | $50,560 | $84,520 |
Source: Public Records
Map
Nearby Homes
- 3 Stoddard Rd
- 166 Beach Ave
- 44 Meadow View Rd
- 48 Morris Ave
- 119 Cove St
- 560 Silver Sands Rd Unit 703
- 19 Rhea St
- 114 Cove St
- 86 Cove St
- 506 Lighthouse Rd
- 16 Catherine St
- 75 Townsend Ave
- 262 & 264 Cosey Beach Ave
- 63 Coleman St Unit 12
- 42 Oregon Ave
- 216 Cosey Beach Ave
- 64 Coe Ave
- 15 Arden St
- 239 Coe Ave
- 26 Nelson St
Your Personal Tour Guide
Ask me questions while you tour the home.