J
Buyer's Agent in 2020
Judith Smith
John C Ricotta & Assoc.
(508) 274-4100
10 in this area
37 Total Sales


Estimated Value: $4,918,000 - $5,544,418
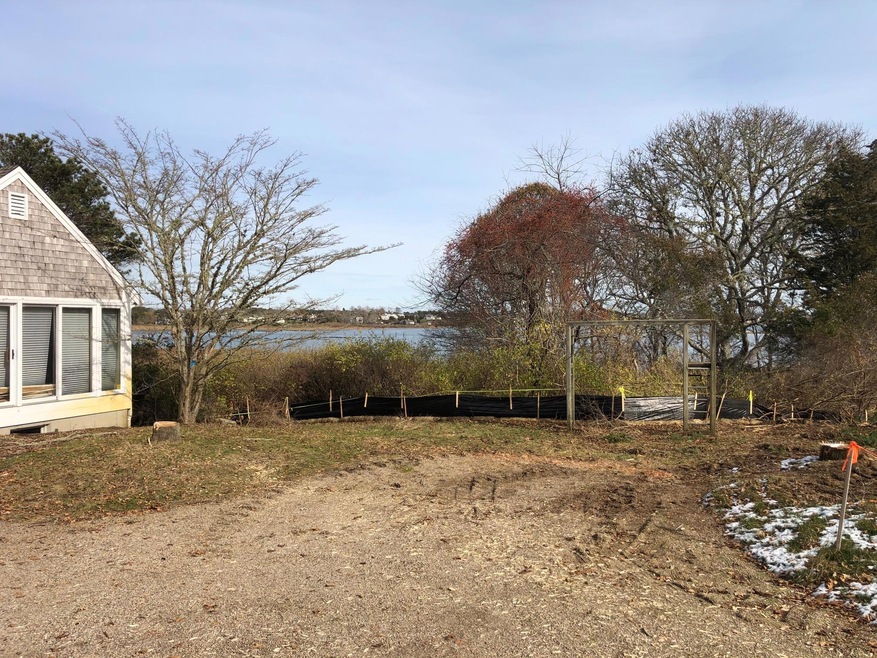
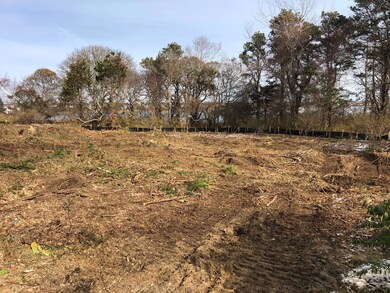
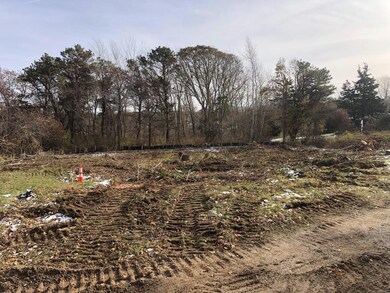
Premier opportunity to build on Oyster Pond River waterfront. The 3.19-acres provides an ultimate private setting with expansive views that stretch from Oyster Pond River towards Chatham Village. Plans and approvals in place for a 7-bedroom home with pool.
Last Agent to Sell the Property
Chris Rhinesmith
Compass Massachusetts, LLC Listed on: 11/19/2019
| Date | Buyer | Sale Price | Title Company |
|---|---|---|---|
| 22 Captain Sears Way Rt | $2,300,000 | None Available | |
| Philip A Richardson Nt | $1,230,000 | -- | |
| G Mcdonald T J | -- | -- | |
| Mcdonald Margaret O | -- | -- |
| Date | Event | Price | List to Sale | Price per Sq Ft | Prior Sale |
|---|---|---|---|---|---|
| 09/03/2020 09/03/20 | Sold | $2,300,000 | 0.0% | $1,091 / Sq Ft | |
| 08/07/2020 08/07/20 | Pending | -- | -- | -- | |
| 11/20/2019 11/20/19 | For Sale | $2,300,000 | +87.0% | $1,091 / Sq Ft | |
| 06/29/2018 06/29/18 | Sold | $1,230,000 | -38.3% | $424 / Sq Ft | View Prior Sale |
| 05/27/2018 05/27/18 | Pending | -- | -- | -- | |
| 03/17/2016 03/17/16 | For Sale | $1,995,000 | -- | $688 / Sq Ft |
| Year | Tax Paid | Tax Assessment Tax Assessment Total Assessment is a certain percentage of the fair market value that is determined by local assessors to be the total taxable value of land and additions on the property. | Land | Improvement |
|---|---|---|---|---|
| 2025 | $18,701 | $5,389,200 | $3,433,000 | $1,956,200 |
| 2024 | $14,677 | $4,111,100 | $3,238,700 | $872,400 |
| 2023 | $9,934 | $2,560,400 | $2,560,400 | $0 |
| 2022 | $11,829 | $2,560,400 | $2,560,400 | $0 |
| 2021 | $3,973 | $797,700 | $797,700 | $0 |
| 2020 | $5,695 | $1,181,500 | $797,700 | $383,800 |
| 2019 | $7,815 | $1,611,300 | $1,222,400 | $388,900 |
| 2018 | $7,710 | $1,583,200 | $1,229,700 | $353,500 |
| 2017 | $14,661 | $2,914,700 | $2,534,500 | $380,200 |
| 2016 | $14,204 | $2,829,400 | $2,484,500 | $344,900 |
| 2015 | $13,737 | $2,752,900 | $2,413,500 | $339,400 |
| 2014 | $13,960 | $2,748,000 | $2,413,500 | $334,500 |
J
Buyer's Agent in 2020
Judith Smith
John C Ricotta & Assoc.
(508) 274-4100
10 in this area
37 Total Sales
J
Seller's Agent in 2018
John Ricotta
John C Ricotta & Assoc.
(508) 945-5000
4 in this area
17 Total Sales

Buyer's Agent in 2018
Chris Rhinesmith
Compass Massachusetts, LLC
(617) 967-0987
39 in this area
131 Total Sales
Source: Cape Cod & Islands Association of REALTORS®
MLS Number: 21908235
APN: CHAT-000011C-000005DH000017
Disclaimer: Certain information contained herein is derived from information provided by parties other than Homes.com. All information provided is deemed reliable, but is not guaranteed to be accurate and should be independently verified.
![]() All data relating to real estate for sale on this page comes from the Broker Reciprocity (BR) of the Cape Cod & Islands Multiple Listing Service, Inc. Detailed information about real estate listings held by brokerage firms other than CC&I Assoc. of REALTORS®, Inc. includes the name of the listing company. Neither the listing company nor CC&I Assoc. of REALTORS®, Inc. shall be responsible for any typographical errors, misinformation, misprints and shall be held totally harmless. The Broker providing this data believes it to be correct, but advises interested parties to confirm any item before relying on it in a purchase decision. All properties are subject to prior sale, changes, or withdrawal. Copyright 2026 © Cape Cod & Islands Multiple Listing Service, Inc. All rights reserved.
All data relating to real estate for sale on this page comes from the Broker Reciprocity (BR) of the Cape Cod & Islands Multiple Listing Service, Inc. Detailed information about real estate listings held by brokerage firms other than CC&I Assoc. of REALTORS®, Inc. includes the name of the listing company. Neither the listing company nor CC&I Assoc. of REALTORS®, Inc. shall be responsible for any typographical errors, misinformation, misprints and shall be held totally harmless. The Broker providing this data believes it to be correct, but advises interested parties to confirm any item before relying on it in a purchase decision. All properties are subject to prior sale, changes, or withdrawal. Copyright 2026 © Cape Cod & Islands Multiple Listing Service, Inc. All rights reserved.
Ask me questions while you tour the home.