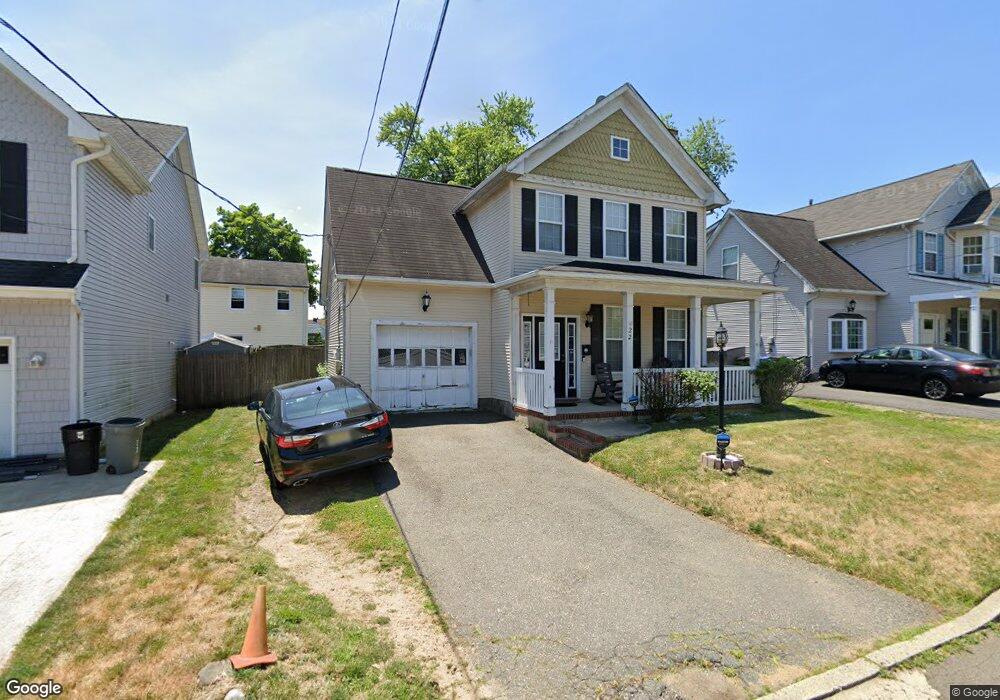
22 Center St Matawan, NJ 07747
Estimated Value: $508,000 - $605,960
4
Beds
2
Baths
1,536
Sq Ft
$367/Sq Ft
Est. Value
About This Home
This home is located at 22 Center St, Matawan, NJ 07747 and is currently estimated at $563,990, approximately $367 per square foot. 22 Center St is a home located in Monmouth County with nearby schools including Matawan Reg High School, St. Joseph Elementary School, and St Benedict School.
Ownership History
Date
Name
Owned For
Owner Type
Purchase Details
Closed on
Apr 8, 2008
Sold by
Ryan Steven E and Ryan Amber Lynn
Bought by
Kent Debro and Kent Joanne
Current Estimated Value
Home Financials for this Owner
Home Financials are based on the most recent Mortgage that was taken out on this home.
Original Mortgage
$273,516
Interest Rate
6.54%
Mortgage Type
FHA
Purchase Details
Closed on
Jan 23, 2004
Sold by
Tureby William
Bought by
Ryan Steve and Ryan Amber
Purchase Details
Closed on
Jul 24, 2000
Sold by
Collins Barbara
Bought by
Turbey William
Create a Home Valuation Report for This Property
The Home Valuation Report is an in-depth analysis detailing your home's value as well as a comparison with similar homes in the area
Home Values in the Area
Average Home Value in this Area
Purchase History
| Date | Buyer | Sale Price | Title Company |
|---|---|---|---|
| Kent Debro | $275,000 | None Available | |
| Ryan Steve | $270,900 | -- | |
| Turbey William | $74,500 | -- |
Source: Public Records
Mortgage History
| Date | Status | Borrower | Loan Amount |
|---|---|---|---|
| Previous Owner | Kent Debro | $273,516 |
Source: Public Records
Tax History Compared to Growth
Tax History
| Year | Tax Paid | Tax Assessment Tax Assessment Total Assessment is a certain percentage of the fair market value that is determined by local assessors to be the total taxable value of land and additions on the property. | Land | Improvement |
|---|---|---|---|---|
| 2025 | $11,469 | $567,600 | $283,500 | $284,100 |
| 2024 | $11,153 | $525,400 | $298,500 | $226,900 |
| 2023 | $11,153 | $513,000 | $288,500 | $224,500 |
| 2022 | $10,115 | $424,300 | $210,500 | $213,800 |
| 2021 | $7,520 | $372,300 | $177,500 | $194,800 |
| 2020 | $9,850 | $360,000 | $167,500 | $192,500 |
| 2019 | $9,588 | $351,200 | $163,500 | $187,700 |
| 2018 | $9,540 | $343,800 | $158,500 | $185,300 |
| 2017 | $9,298 | $330,300 | $148,500 | $181,800 |
| 2016 | $8,899 | $322,900 | $143,500 | $179,400 |
| 2015 | $8,227 | $300,800 | $128,500 | $172,300 |
| 2014 | $8,221 | $301,700 | $123,500 | $178,200 |
Source: Public Records
Map
Nearby Homes
- 101 Broad St
- 9 Fountain Ave
- 32 Lake Blvd
- 10 7th St
- 5 7th St
- 258 Jackson St
- 7 Lucia Ct Unit 7
- 284 Broad St
- 537 S Atlantic Ave
- 320 Main St
- 7 Sunset Ave
- 111 Courtland Ln
- 12 S Atlantic Ave Unit 14
- 26 Edgewater Dr
- 22 Overhill Rd
- 70 Northland Ln
- 14 Dolan Ave
- 8 Sutphin Ave
- 14 New Brunswick Ave
- 40 North Cir