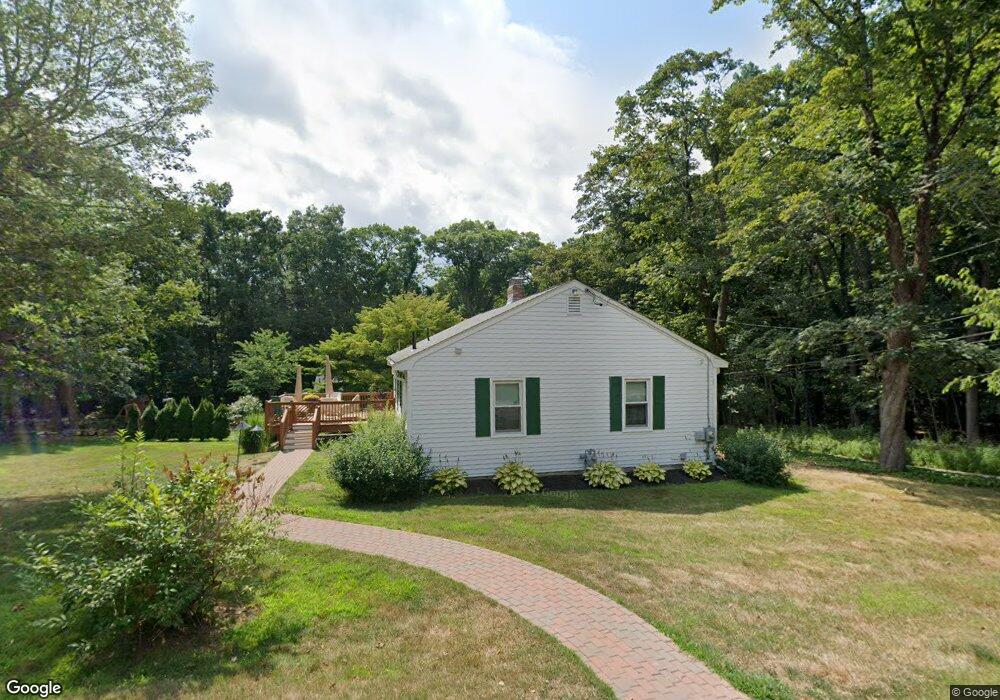
22 Chestnut St Grafton, MA 01519
Estimated Value: $435,000 - $504,000
3
Beds
1
Bath
1,092
Sq Ft
$438/Sq Ft
Est. Value
About This Home
This home is located at 22 Chestnut St, Grafton, MA 01519 and is currently estimated at $478,099, approximately $437 per square foot. 22 Chestnut St is a home located in Worcester County with nearby schools including Grafton High School, Silver Spruce Montessori School, and Touchstone Community School.
Ownership History
Date
Name
Owned For
Owner Type
Purchase Details
Closed on
Jan 14, 2025
Sold by
Wilson Beverly J and Wilson Paul H
Bought by
Paul H Wilson T H and Paul Wilson
Current Estimated Value
Purchase Details
Closed on
Oct 31, 1969
Bought by
Wilson Paul H and Wilson Beverly J
Create a Home Valuation Report for This Property
The Home Valuation Report is an in-depth analysis detailing your home's value as well as a comparison with similar homes in the area
Home Values in the Area
Average Home Value in this Area
Purchase History
| Date | Buyer | Sale Price | Title Company |
|---|---|---|---|
| Paul H Wilson T H | -- | None Available | |
| Wilson Paul H | -- | -- |
Source: Public Records
Mortgage History
| Date | Status | Borrower | Loan Amount |
|---|---|---|---|
| Previous Owner | Wilson Paul H | $221,401 | |
| Previous Owner | Wilson Paul H | $221,665 | |
| Previous Owner | Wilson Paul H | $114,800 |
Source: Public Records
Tax History Compared to Growth
Tax History
| Year | Tax Paid | Tax Assessment Tax Assessment Total Assessment is a certain percentage of the fair market value that is determined by local assessors to be the total taxable value of land and additions on the property. | Land | Improvement |
|---|---|---|---|---|
| 2025 | $5,310 | $380,900 | $168,300 | $212,600 |
| 2024 | $5,189 | $362,600 | $160,300 | $202,300 |
| 2023 | $5,049 | $321,400 | $160,300 | $161,100 |
| 2022 | $4,772 | $282,700 | $137,700 | $145,000 |
| 2021 | $4,603 | $267,900 | $125,200 | $142,700 |
| 2020 | $4,387 | $265,900 | $125,200 | $140,700 |
| 2019 | $4,213 | $252,900 | $121,600 | $131,300 |
| 2018 | $3,977 | $239,700 | $121,600 | $118,100 |
| 2017 | $3,839 | $234,100 | $116,000 | $118,100 |
| 2016 | $3,621 | $216,200 | $103,300 | $112,900 |
| 2015 | $3,511 | $212,800 | $97,300 | $115,500 |
| 2014 | $3,427 | $224,600 | $119,700 | $104,900 |
Source: Public Records
Map
Nearby Homes
- 8 Chestnut St
- 63 North St
- 66 North St
- 17 Worcester St
- 49 South St
- 16 Clearview St
- 25 Clearview St
- 4 Abby Rd
- 11 1/2 Carroll Rd Unit B
- 63 Providence Rd Unit 2
- 30 Nottingham Rd
- 9 Logan Path
- 1 Doris Dr
- 42 Gordon Cir Unit 42
- 55 Carroll Rd
- 7 Pleasant St
- 29 Pullard Rd
- 55 Estabrook St
- 13 Pullard Rd Unit 38
- 8 Hudson Ave