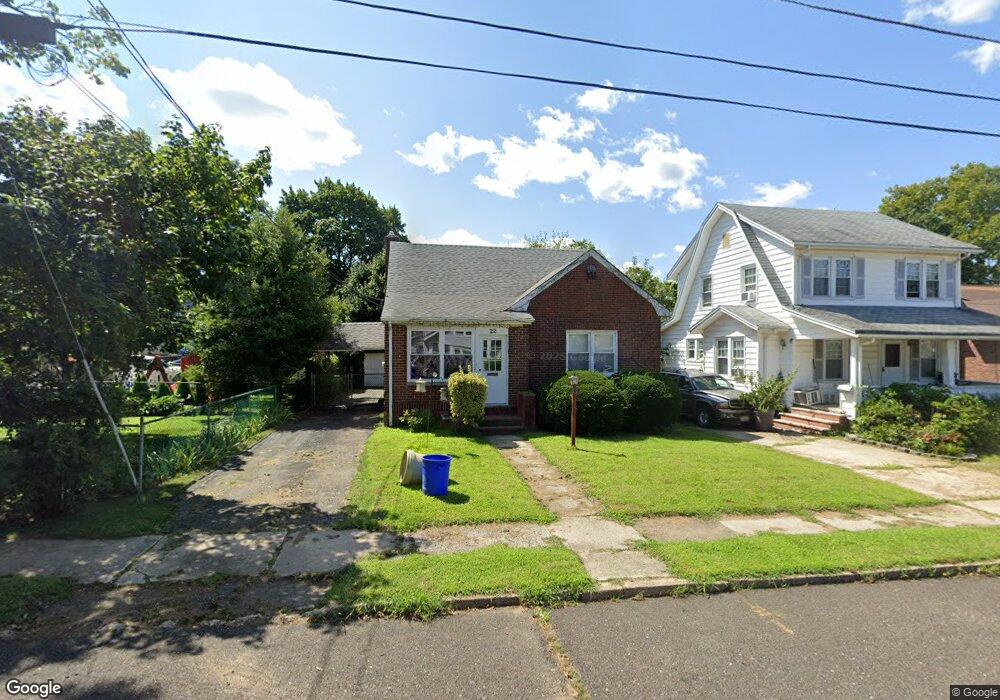
22 Colfax St South River, NJ 08882
Estimated Value: $361,733 - $465,000
--
Bed
--
Bath
1,235
Sq Ft
$333/Sq Ft
Est. Value
About This Home
This home is located at 22 Colfax St, South River, NJ 08882 and is currently estimated at $410,933, approximately $332 per square foot. 22 Colfax St is a home located in Middlesex County with nearby schools including South River Primary School, South River Elementary School, and South River Middle School.
Ownership History
Date
Name
Owned For
Owner Type
Purchase Details
Closed on
Jan 15, 1998
Sold by
Hode Dolores
Bought by
O'Connor Michael and O'Connor Edward
Current Estimated Value
Home Financials for this Owner
Home Financials are based on the most recent Mortgage that was taken out on this home.
Original Mortgage
$99,000
Outstanding Balance
$17,000
Interest Rate
7.02%
Mortgage Type
FHA
Estimated Equity
$393,933
Purchase Details
Closed on
Dec 7, 1995
Sold by
Galecki Anna
Bought by
Hode Dolores
Create a Home Valuation Report for This Property
The Home Valuation Report is an in-depth analysis detailing your home's value as well as a comparison with similar homes in the area
Home Values in the Area
Average Home Value in this Area
Purchase History
| Date | Buyer | Sale Price | Title Company |
|---|---|---|---|
| O'Connor Michael | $110,000 | -- | |
| Hode Dolores | $100,000 | -- |
Source: Public Records
Mortgage History
| Date | Status | Borrower | Loan Amount |
|---|---|---|---|
| Open | O'Connor Michael | $99,000 |
Source: Public Records
Tax History Compared to Growth
Tax History
| Year | Tax Paid | Tax Assessment Tax Assessment Total Assessment is a certain percentage of the fair market value that is determined by local assessors to be the total taxable value of land and additions on the property. | Land | Improvement |
|---|---|---|---|---|
| 2025 | $5,504 | $216,100 | $112,800 | $103,300 |
| 2024 | $5,340 | $216,100 | $112,800 | $103,300 |
| 2023 | $5,340 | $216,100 | $112,800 | $103,300 |
| 2022 | $5,247 | $216,100 | $112,800 | $103,300 |
| 2021 | $3,216 | $216,100 | $112,800 | $103,300 |
| 2020 | $4,942 | $216,100 | $112,800 | $103,300 |
| 2019 | $6,087 | $73,900 | $19,600 | $54,300 |
| 2018 | $5,941 | $73,900 | $19,600 | $54,300 |
| 2017 | $5,724 | $73,900 | $19,600 | $54,300 |
| 2016 | $5,507 | $73,900 | $19,600 | $54,300 |
| 2015 | $5,384 | $73,900 | $19,600 | $54,300 |
| 2014 | $5,260 | $73,900 | $19,600 | $54,300 |
Source: Public Records
Map
Nearby Homes
- 11 Davison Ave
- 19 Wilcox Ave
- 22 Roosevelt St
- 16 Pulawski Ave
- 5 David St
- 33 W Grochowiak St
- 150 Main St
- 392 Old Bridge Turnpike
- 28 Johnson Place
- 86 Hillside Ave
- 23 W Grochowiak St
- 212 Old Bridge Turnpike
- 5 Fairview Ave
- 48 Harvey Cir
- 188 Prigmore St
- 363 Cranbury Rd Unit B7
- 12 Clinton St
- 86 James St
- 35 Willett Ave
- 147 Old Bridge Turnpike