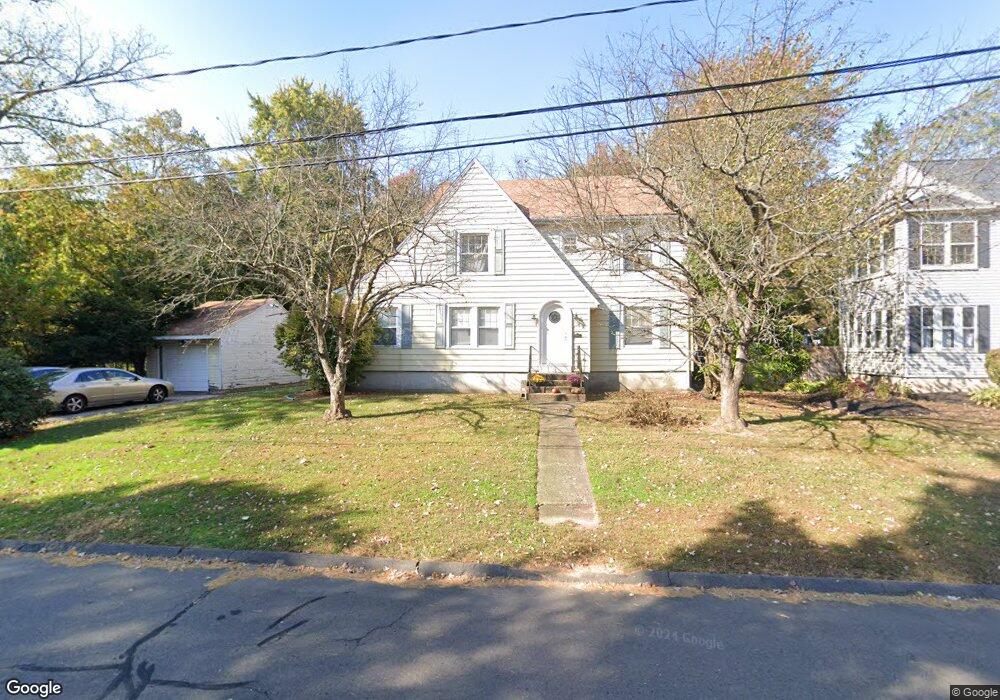
22 Coventry Rd Bristol, CT 06010
North Bristol NeighborhoodEstimated Value: $356,000 - $419,000
3
Beds
2
Baths
1,855
Sq Ft
$209/Sq Ft
Est. Value
About This Home
This home is located at 22 Coventry Rd, Bristol, CT 06010 and is currently estimated at $387,509, approximately $208 per square foot. 22 Coventry Rd is a home located in Hartford County with nearby schools including Stafford School, Chippens Hill Middle School, and Bristol Eastern High School.
Ownership History
Date
Name
Owned For
Owner Type
Purchase Details
Closed on
Dec 31, 1996
Sold by
Rossignol Andre D
Bought by
Krulicki Doris
Current Estimated Value
Home Financials for this Owner
Home Financials are based on the most recent Mortgage that was taken out on this home.
Original Mortgage
$100,000
Outstanding Balance
$17,263
Interest Rate
7.55%
Mortgage Type
Unknown
Estimated Equity
$370,246
Create a Home Valuation Report for This Property
The Home Valuation Report is an in-depth analysis detailing your home's value as well as a comparison with similar homes in the area
Home Values in the Area
Average Home Value in this Area
Purchase History
| Date | Buyer | Sale Price | Title Company |
|---|---|---|---|
| Krulicki Doris | $125,000 | -- |
Source: Public Records
Mortgage History
| Date | Status | Borrower | Loan Amount |
|---|---|---|---|
| Open | Krulicki Doris | $100,000 | |
| Previous Owner | Krulicki Doris | $115,000 | |
| Previous Owner | Krulicki Doris | $115,000 |
Source: Public Records
Tax History
| Year | Tax Paid | Tax Assessment Tax Assessment Total Assessment is a certain percentage of the fair market value that is determined by local assessors to be the total taxable value of land and additions on the property. | Land | Improvement |
|---|---|---|---|---|
| 2025 | $6,060 | $179,550 | $38,780 | $140,770 |
| 2024 | $5,719 | $179,550 | $38,780 | $140,770 |
| 2023 | $5,449 | $179,550 | $38,780 | $140,770 |
| 2022 | $4,878 | $127,190 | $29,400 | $97,790 |
| 2021 | $4,878 | $127,190 | $29,400 | $97,790 |
| 2020 | $4,878 | $127,190 | $29,400 | $97,790 |
| 2019 | $4,840 | $127,190 | $29,400 | $97,790 |
| 2018 | $4,691 | $127,190 | $29,400 | $97,790 |
| 2017 | $4,494 | $124,740 | $42,000 | $82,740 |
| 2016 | $4,494 | $124,740 | $42,000 | $82,740 |
| 2015 | $4,317 | $124,740 | $42,000 | $82,740 |
| 2014 | $4,317 | $124,740 | $42,000 | $82,740 |
Source: Public Records
Map
Nearby Homes
- 941 Farmington Ave
- 64 Fanway Ave
- 81 Lancaster Rd
- 30 Adeline Ave
- 20 Westchester Dr
- 135 Jerome Ave
- 3 Sandra St
- 55 Beths Ave Unit 77
- 169 Morningside Dr E
- 79 Beths Ave Unit 100
- 175 Moody St
- 97 Jacqueline Dr
- 35 Jasmine St
- 225 Stonecrest Dr
- 1325 Farmington Ave Unit 52
- 0 Fairlawn St
- 92 Garfield Rd
- 1 Hickory St
- 179 Mark St
- 1469 Farmington Ave Unit 56
Your Personal Tour Guide
Ask me questions while you tour the home.