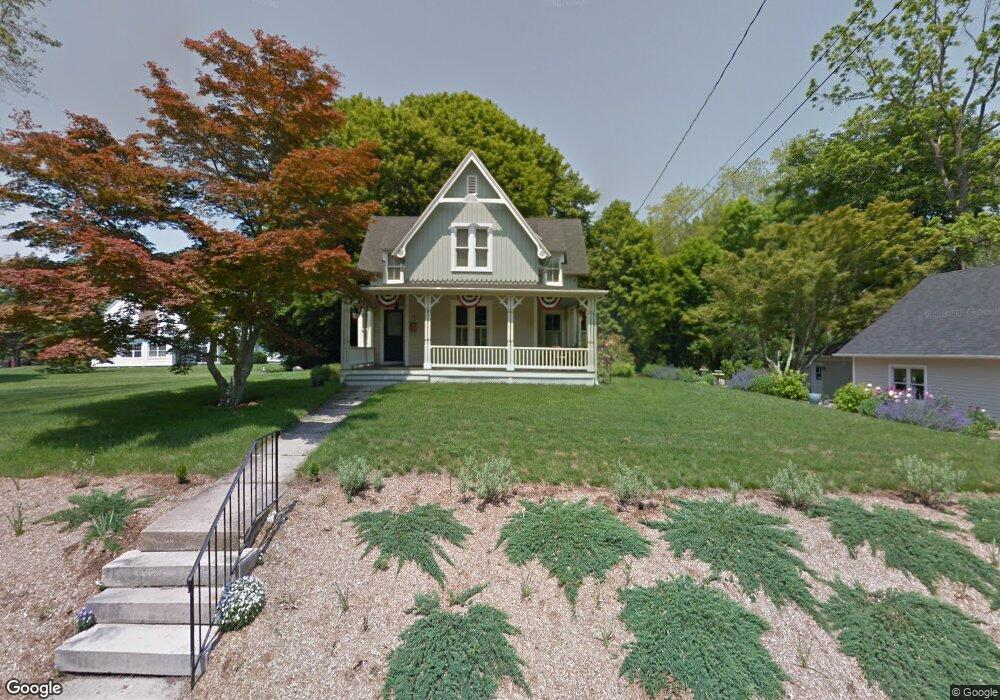
22 Cross St Westerly, RI 02891
Estimated Value: $644,000 - $753,862
3
Beds
2
Baths
1,600
Sq Ft
$438/Sq Ft
Est. Value
About This Home
This home is located at 22 Cross St, Westerly, RI 02891 and is currently estimated at $701,466, approximately $438 per square foot. 22 Cross St is a home located in Washington County with nearby schools including Westerly High School and St. Michael School.
Ownership History
Date
Name
Owned For
Owner Type
Purchase Details
Closed on
Sep 24, 2009
Sold by
Thomsen Matthew H
Bought by
Rice Theodore Lee and Rice Shan Haley
Current Estimated Value
Purchase Details
Closed on
Jul 5, 2007
Sold by
Donohue Sean and Donohue Kelly
Bought by
Rice Theodore L and Rice Shan H
Home Financials for this Owner
Home Financials are based on the most recent Mortgage that was taken out on this home.
Original Mortgage
$299,250
Interest Rate
6.39%
Mortgage Type
Purchase Money Mortgage
Purchase Details
Closed on
Sep 23, 2002
Sold by
Anthony Louise K and Constantine Richard W
Bought by
Donohue Sean C and Donohue Kelly R
Purchase Details
Closed on
Dec 28, 2001
Sold by
Est Day Irene T and O-Day Stephen V
Bought by
Constantine Richard W and Constantine Mallory M
Create a Home Valuation Report for This Property
The Home Valuation Report is an in-depth analysis detailing your home's value as well as a comparison with similar homes in the area
Home Values in the Area
Average Home Value in this Area
Purchase History
| Date | Buyer | Sale Price | Title Company |
|---|---|---|---|
| Rice Theodore Lee | -- | -- | |
| Thomsen Matthew H | -- | -- | |
| Rice Theodore Lee | $21,525 | -- | |
| Rice Theodore L | $399,000 | -- | |
| Donohue Sean C | $277,500 | -- | |
| Constantine Richard W | $187,500 | -- | |
| Rice Theodore Lee | -- | -- | |
| Rice Theodore L | $399,000 | -- | |
| Donohue Sean C | $277,500 | -- | |
| Constantine Richard W | $187,500 | -- |
Source: Public Records
Mortgage History
| Date | Status | Borrower | Loan Amount |
|---|---|---|---|
| Open | Constantine Richard W | $304,800 | |
| Previous Owner | Constantine Richard W | $299,250 |
Source: Public Records
Tax History
| Year | Tax Paid | Tax Assessment Tax Assessment Total Assessment is a certain percentage of the fair market value that is determined by local assessors to be the total taxable value of land and additions on the property. | Land | Improvement |
|---|---|---|---|---|
| 2025 | $4,954 | $636,800 | $194,700 | $442,100 |
| 2024 | $5,194 | $497,000 | $140,000 | $357,000 |
| 2023 | $4,378 | $430,900 | $140,000 | $290,900 |
| 2022 | $4,352 | $430,900 | $140,000 | $290,900 |
| 2021 | $4,381 | $363,300 | $122,200 | $241,100 |
| 2020 | $4,305 | $363,300 | $122,200 | $241,100 |
| 2019 | $4,265 | $363,300 | $122,200 | $241,100 |
| 2018 | $4,068 | $329,400 | $122,200 | $207,200 |
| 2017 | $3,953 | $329,400 | $122,200 | $207,200 |
| 2016 | $3,953 | $329,400 | $122,200 | $207,200 |
| 2015 | $3,782 | $336,800 | $124,600 | $212,200 |
| 2014 | $3,722 | $336,800 | $124,600 | $212,200 |
Source: Public Records
Map
Nearby Homes
- 25 School St Unit 2
- 16 Spring St
- 2 Gravity Ct
- 15 Moss St
- 28 Spruce St
- 60 Margin St Unit 102
- 141 W Broad St
- 21 Linden St
- 19 Crestview Dr Unit C
- 23 Abbey Ln Unit 12
- 24 Abbey Ln Unit 13
- 55 Pleasant St
- 22 Colonial Dr
- 51 Pequot Trail
- 12 Batterson Ave
- 5 Marion St
- 2 Marichris Dr
- 12 Apache Dr Unit A
- 33 Whipple Ave
- 17 Apache Dr Unit G
Your Personal Tour Guide
Ask me questions while you tour the home.