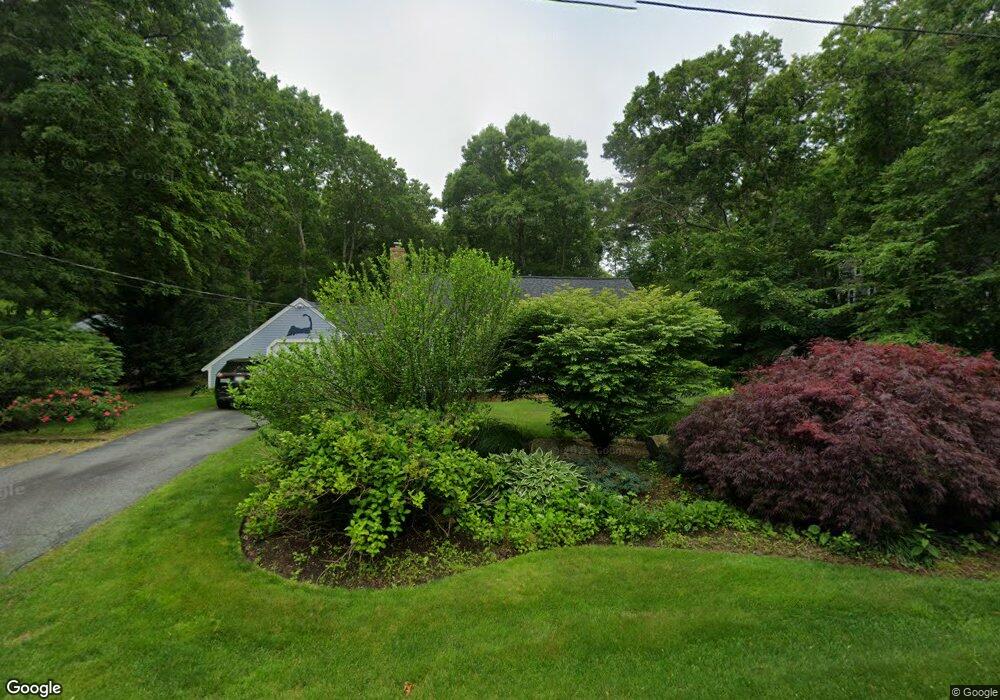
22 Crowell Rd Sandwich, MA 02563
Estimated Value: $687,000 - $816,000
3
Beds
3
Baths
1,824
Sq Ft
$409/Sq Ft
Est. Value
About This Home
This home is located at 22 Crowell Rd, Sandwich, MA 02563 and is currently estimated at $746,046, approximately $409 per square foot. 22 Crowell Rd is a home located in Barnstable County with nearby schools including Sandwich Middle High School, Waldorf School of Cape Cod, and Bridgeview Montessori School.
Ownership History
Date
Name
Owned For
Owner Type
Purchase Details
Closed on
Feb 1, 2021
Sold by
Lyons William J and Lyons Kerin E
Bought by
Howard Kerin E
Current Estimated Value
Purchase Details
Closed on
Feb 26, 2016
Sold by
Int Kerin E Lyons and Lyons Kerin E
Bought by
William J Lyons Lt and Lyons William J
Purchase Details
Closed on
Feb 5, 2016
Sold by
Int Kerin E Lyons and Lyons Kerin E
Bought by
William J Lyons Lt and Lyons William J
Create a Home Valuation Report for This Property
The Home Valuation Report is an in-depth analysis detailing your home's value as well as a comparison with similar homes in the area
Home Values in the Area
Average Home Value in this Area
Purchase History
| Date | Buyer | Sale Price | Title Company |
|---|---|---|---|
| Howard Kerin E | -- | None Available | |
| Lyons William J | -- | None Available | |
| William J Lyons Lt | -- | -- | |
| William J Lyons Lt | -- | -- |
Source: Public Records
Tax History Compared to Growth
Tax History
| Year | Tax Paid | Tax Assessment Tax Assessment Total Assessment is a certain percentage of the fair market value that is determined by local assessors to be the total taxable value of land and additions on the property. | Land | Improvement |
|---|---|---|---|---|
| 2025 | $6,014 | $569,000 | $209,400 | $359,600 |
| 2024 | $5,459 | $505,500 | $178,900 | $326,600 |
| 2023 | $5,337 | $464,100 | $162,600 | $301,500 |
| 2022 | $5,077 | $385,800 | $142,600 | $243,200 |
| 2021 | $4,862 | $353,100 | $136,400 | $216,700 |
| 2020 | $4,893 | $341,900 | $136,400 | $205,500 |
| 2019 | $4,759 | $332,300 | $139,900 | $192,400 |
| 2018 | $5,010 | $314,200 | $135,100 | $179,100 |
| 2017 | $4,452 | $298,200 | $130,800 | $167,400 |
| 2016 | $4,188 | $289,400 | $126,100 | $163,300 |
| 2015 | $3,994 | $269,500 | $116,600 | $152,900 |
Source: Public Records
Map
Nearby Homes