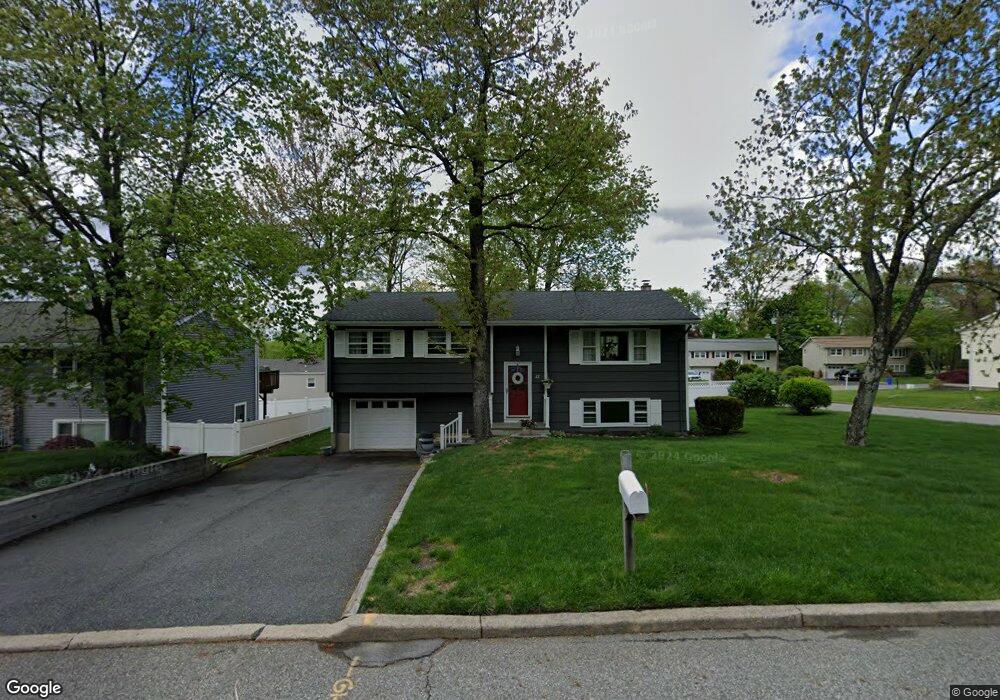
22 Dean Ave Butler, NJ 07405
Estimated Value: $573,000 - $658,000
--
Bed
--
Bath
1,871
Sq Ft
$323/Sq Ft
Est. Value
About This Home
This home is located at 22 Dean Ave, Butler, NJ 07405 and is currently estimated at $603,454, approximately $322 per square foot. 22 Dean Ave is a home located in Morris County with nearby schools including Aaron Decker School, Richard Butler School, and St Anthony Of Padua.
Ownership History
Date
Name
Owned For
Owner Type
Purchase Details
Closed on
Mar 12, 2025
Sold by
Butler Mark J and Butler Patrick F
Bought by
Butler John Patrick and Butler Gillian Crisman
Current Estimated Value
Home Financials for this Owner
Home Financials are based on the most recent Mortgage that was taken out on this home.
Original Mortgage
$330,000
Outstanding Balance
$328,304
Interest Rate
6.85%
Mortgage Type
New Conventional
Estimated Equity
$275,150
Purchase Details
Closed on
May 25, 2023
Sold by
Butler Patricia A
Bought by
Butler Daniel J and Butler Mark J
Create a Home Valuation Report for This Property
The Home Valuation Report is an in-depth analysis detailing your home's value as well as a comparison with similar homes in the area
Home Values in the Area
Average Home Value in this Area
Purchase History
| Date | Buyer | Sale Price | Title Company |
|---|---|---|---|
| Butler John Patrick | $550,000 | None Listed On Document | |
| Butler John Patrick | $550,000 | None Listed On Document | |
| Butler Daniel J | -- | None Listed On Document | |
| Butler Daniel J | -- | None Listed On Document |
Source: Public Records
Mortgage History
| Date | Status | Borrower | Loan Amount |
|---|---|---|---|
| Open | Butler John Patrick | $330,000 | |
| Closed | Butler John Patrick | $330,000 |
Source: Public Records
Tax History Compared to Growth
Tax History
| Year | Tax Paid | Tax Assessment Tax Assessment Total Assessment is a certain percentage of the fair market value that is determined by local assessors to be the total taxable value of land and additions on the property. | Land | Improvement |
|---|---|---|---|---|
| 2025 | $10,525 | $467,900 | $288,000 | $179,900 |
| 2024 | $10,698 | $421,500 | $253,000 | $168,500 |
| 2023 | $10,698 | $403,100 | $248,000 | $155,100 |
| 2022 | $7,546 | $368,000 | $223,000 | $145,000 |
| 2021 | $7,546 | $236,700 | $143,600 | $93,100 |
| 2020 | $8,843 | $236,700 | $143,600 | $93,100 |
| 2019 | $8,982 | $245,800 | $143,600 | $102,200 |
| 2018 | $8,866 | $245,800 | $143,600 | $102,200 |
| 2017 | $8,640 | $245,800 | $143,600 | $102,200 |
| 2016 | $8,416 | $245,800 | $143,600 | $102,200 |
| 2015 | $8,031 | $245,800 | $143,600 | $102,200 |
| 2014 | $7,775 | $245,800 | $143,600 | $102,200 |
Source: Public Records
Map
Nearby Homes