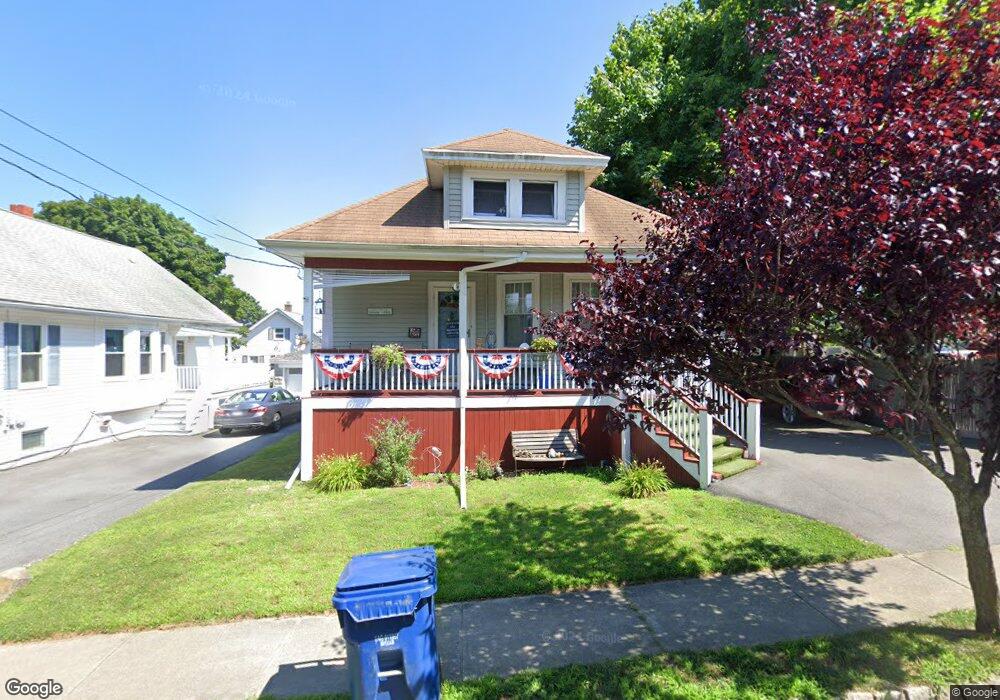
22 Deane St Fairhaven, MA 02719
North Fairhaven NeighborhoodEstimated Value: $414,000 - $452,000
3
Beds
1
Bath
1,513
Sq Ft
$282/Sq Ft
Est. Value
About This Home
This home is located at 22 Deane St, Fairhaven, MA 02719 and is currently estimated at $426,920, approximately $282 per square foot. 22 Deane St is a home located in Bristol County with nearby schools including Fairhaven High School, Alma Del Mar Charter School, and St. Joseph School.
Ownership History
Date
Name
Owned For
Owner Type
Purchase Details
Closed on
Nov 29, 2006
Sold by
Bkb Mgmt Llc
Bought by
Sylvia Jean M and Sylvia John P
Current Estimated Value
Purchase Details
Closed on
Nov 16, 2006
Sold by
Thomas Bruce and Caton Robert Gene
Bought by
Bkb Mgmt Llc
Purchase Details
Closed on
Oct 16, 2006
Sold by
Guertin Donna M
Bought by
Thomas Bruce and Caton Robert Gene
Purchase Details
Closed on
Jul 12, 2004
Sold by
Guertin Donna M
Bought by
Guertin Donna M and Guertin Leo E
Purchase Details
Closed on
Jun 29, 2001
Sold by
Farrington Brian
Bought by
Guertin Donna M
Purchase Details
Closed on
Apr 28, 2000
Sold by
Pimental Robert M
Bought by
Farrington Brian
Purchase Details
Closed on
Nov 29, 1995
Sold by
Pimental Robert J and Pimentl Bernice As
Bought by
Pimental Robert M
Create a Home Valuation Report for This Property
The Home Valuation Report is an in-depth analysis detailing your home's value as well as a comparison with similar homes in the area
Home Values in the Area
Average Home Value in this Area
Purchase History
| Date | Buyer | Sale Price | Title Company |
|---|---|---|---|
| Sylvia Jean M | $245,000 | -- | |
| Bkb Mgmt Llc | -- | -- | |
| Thomas Bruce | $183,800 | -- | |
| Guertin Donna M | -- | -- | |
| Guertin Donna M | $148,000 | -- | |
| Farrington Brian | $124,000 | -- | |
| Pimental Robert M | $90,000 | -- |
Source: Public Records
Mortgage History
| Date | Status | Borrower | Loan Amount |
|---|---|---|---|
| Open | Pimental Robert M | $242,750 | |
| Closed | Pimental Robert M | $250,000 |
Source: Public Records
Tax History
| Year | Tax Paid | Tax Assessment Tax Assessment Total Assessment is a certain percentage of the fair market value that is determined by local assessors to be the total taxable value of land and additions on the property. | Land | Improvement |
|---|---|---|---|---|
| 2025 | $2,994 | $321,200 | $168,700 | $152,500 |
| 2024 | $3,034 | $328,700 | $168,700 | $160,000 |
| 2023 | $2,964 | $297,900 | $147,800 | $150,100 |
| 2022 | $2,874 | $281,200 | $137,300 | $143,900 |
| 2021 | $2,743 | $243,000 | $124,300 | $118,700 |
| 2020 | $2,688 | $243,000 | $124,300 | $118,700 |
| 2019 | $2,479 | $212,400 | $103,100 | $109,300 |
| 2018 | $2,378 | $202,400 | $98,100 | $104,300 |
| 2017 | $2,354 | $195,500 | $98,100 | $97,400 |
| 2016 | $2,281 | $187,300 | $98,100 | $89,200 |
| 2015 | $2,256 | $185,700 | $98,100 | $87,600 |
Source: Public Records
Map
Nearby Homes
Your Personal Tour Guide
Ask me questions while you tour the home.