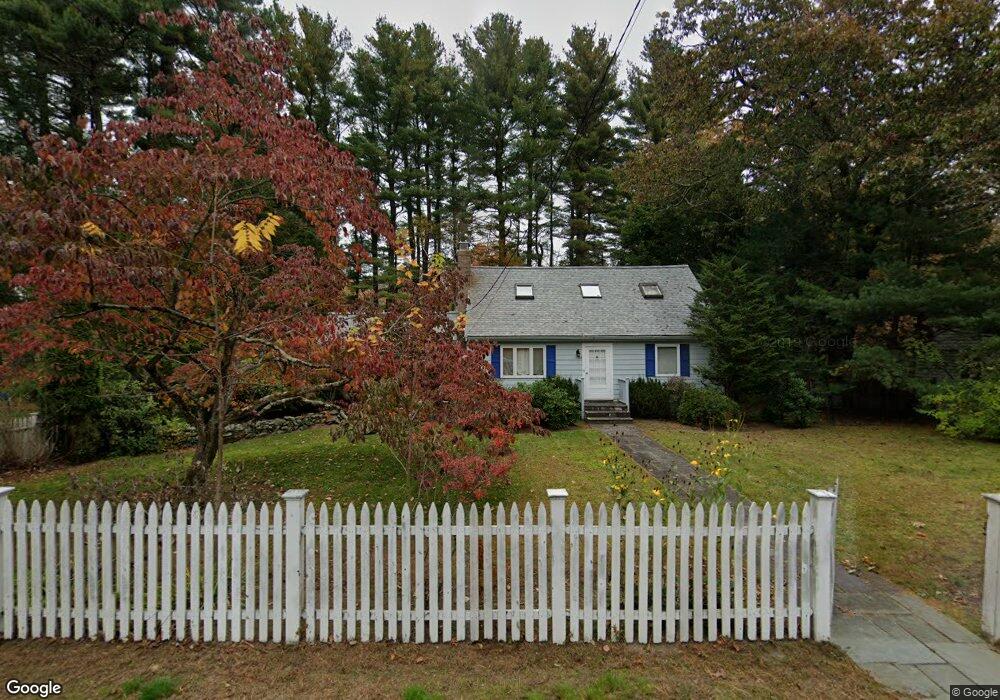
22 Demarco Rd Sudbury, MA 01776
Estimated Value: $882,000 - $972,000
4
Beds
3
Baths
2,217
Sq Ft
$420/Sq Ft
Est. Value
About This Home
This home is located at 22 Demarco Rd, Sudbury, MA 01776 and is currently estimated at $931,850, approximately $420 per square foot. 22 Demarco Rd is a home located in Middlesex County with nearby schools including Peter Noyes Elementary School, Ephraim Curtis Middle School, and Lincoln-Sudbury Regional High School.
Ownership History
Date
Name
Owned For
Owner Type
Purchase Details
Closed on
Aug 18, 2020
Sold by
Myers James A
Bought by
Kumar Virendra
Current Estimated Value
Home Financials for this Owner
Home Financials are based on the most recent Mortgage that was taken out on this home.
Original Mortgage
$488,000
Outstanding Balance
$430,107
Interest Rate
2.9%
Mortgage Type
New Conventional
Estimated Equity
$501,743
Purchase Details
Closed on
Feb 1, 2013
Sold by
Demarco Realty Nt and Myers Beverly J
Bought by
Myers James A
Purchase Details
Closed on
Jan 6, 2012
Sold by
Myers Herbert J
Bought by
Demarco Rt
Purchase Details
Closed on
Jun 12, 2007
Sold by
Myers Eri and Myers James
Bought by
Myers Herbert J
Purchase Details
Closed on
Apr 26, 2000
Sold by
Castelline David G and Castelline Anne S
Bought by
Myers James and Myers Eri
Create a Home Valuation Report for This Property
The Home Valuation Report is an in-depth analysis detailing your home's value as well as a comparison with similar homes in the area
Home Values in the Area
Average Home Value in this Area
Purchase History
| Date | Buyer | Sale Price | Title Company |
|---|---|---|---|
| Kumar Virendra | $610,000 | None Available | |
| Myers James A | -- | -- | |
| Demarco Rt | -- | -- | |
| Myers Herbert J | $550,000 | -- | |
| Myers James | $414,000 | -- |
Source: Public Records
Mortgage History
| Date | Status | Borrower | Loan Amount |
|---|---|---|---|
| Open | Kumar Virendra | $488,000 | |
| Previous Owner | Myers James | $250,000 | |
| Previous Owner | Myers James | $127,000 |
Source: Public Records
Tax History Compared to Growth
Tax History
| Year | Tax Paid | Tax Assessment Tax Assessment Total Assessment is a certain percentage of the fair market value that is determined by local assessors to be the total taxable value of land and additions on the property. | Land | Improvement |
|---|---|---|---|---|
| 2025 | $10,116 | $691,000 | $373,100 | $317,900 |
| 2024 | $9,764 | $668,300 | $362,200 | $306,100 |
| 2023 | $9,982 | $633,000 | $335,300 | $297,700 |
| 2022 | $9,666 | $535,500 | $307,800 | $227,700 |
| 2021 | $9,359 | $497,000 | $307,800 | $189,200 |
| 2020 | $9,170 | $497,000 | $307,800 | $189,200 |
| 2019 | $8,901 | $497,000 | $307,800 | $189,200 |
| 2018 | $9,058 | $505,200 | $328,200 | $177,000 |
| 2017 | $8,492 | $478,700 | $312,200 | $166,500 |
| 2016 | $8,184 | $459,800 | $300,300 | $159,500 |
| 2015 | $8,158 | $463,500 | $305,700 | $157,800 |
| 2014 | $8,132 | $451,000 | $296,700 | $154,300 |
Source: Public Records
Map
Nearby Homes
- 24 Goodnow Rd
- 270 Old Lancaster Rd
- 36 Old Forge Ln
- 427 Concord Rd
- 63 Canterbury Dr
- 12 Camperdown Ln
- 89 Bridle Path
- 4 Elderberry Cir
- 47 Fairbank Rd
- 14 Tanbark Rd
- 25 Bridle Path
- 7 Saddle Ridge Rd
- 55 Widow Rites Ln
- 45 Widow Rites Ln
- 54 Phillips Rd
- 36 Concord Rd
- 10 Bradley Place
- 30 Rolling Ln
- 23 Massasoit Ave
- 21 Summer St
- 26 Demarco Rd
- 16 Demarco Rd
- 27 Demarco Rd
- 19 Demarco Rd
- 32 Demarco Rd
- 15 Demarco Rd
- 12 Demarco Rd
- 31 Demarco Rd
- 43 Drum Ln
- 42 Drum Ln
- 414 Old Lancaster Rd
- 4 Demarco Rd
- 133 Hudson Rd
- 406 Old Lancaster Rd
- 125 Hudson Rd
- 400 Old Lancaster Rd
- 35 Drum Ln
- 34 Drum Ln
- 0 Confidential Unit 72742735
- 434 Old Lancaster Rd