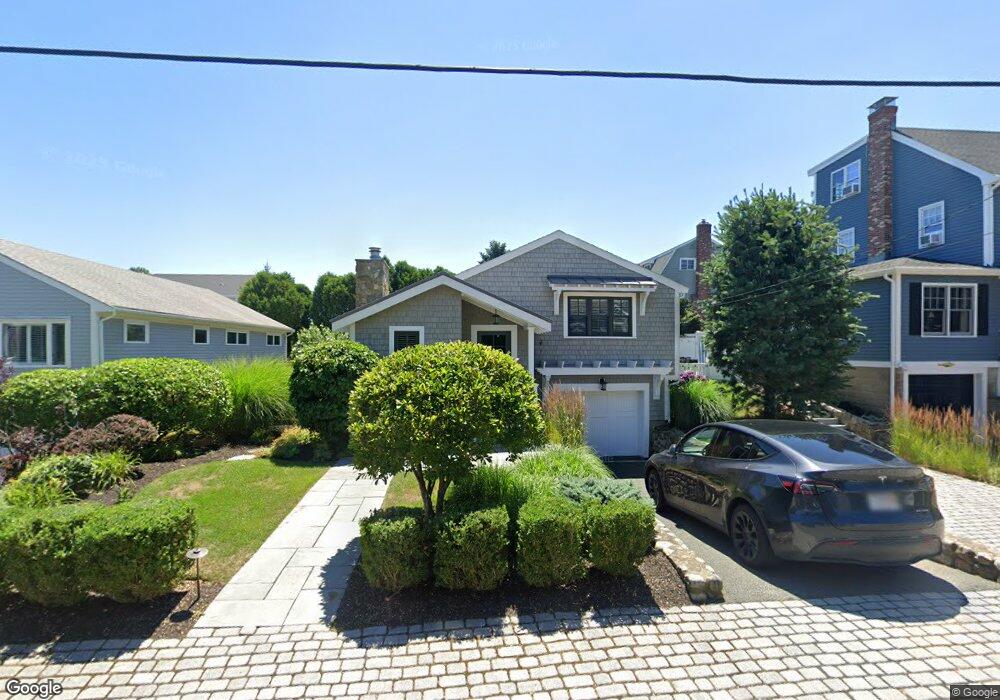
22 Dennett Rd Marblehead, MA 01945
Estimated Value: $1,298,354 - $1,522,000
3
Beds
2
Baths
1,566
Sq Ft
$925/Sq Ft
Est. Value
About This Home
This home is located at 22 Dennett Rd, Marblehead, MA 01945 and is currently estimated at $1,449,089, approximately $925 per square foot. 22 Dennett Rd is a home located in Essex County with nearby schools including Marblehead High School, Devereux School, and Tower School.
Ownership History
Date
Name
Owned For
Owner Type
Purchase Details
Closed on
Apr 24, 2023
Sold by
Curran Scott B and Curran Stephanie C
Bought by
Curran Ft
Current Estimated Value
Purchase Details
Closed on
Nov 30, 2006
Sold by
Dennett Road Rt
Bought by
Curran Scott B and Curran Stephanie C
Home Financials for this Owner
Home Financials are based on the most recent Mortgage that was taken out on this home.
Original Mortgage
$417,000
Interest Rate
6.36%
Mortgage Type
Purchase Money Mortgage
Purchase Details
Closed on
Sep 9, 1999
Sold by
Gormley Ellen H and Gormley Joel T
Bought by
Dennett Road Rt and Shaffer Mark J
Create a Home Valuation Report for This Property
The Home Valuation Report is an in-depth analysis detailing your home's value as well as a comparison with similar homes in the area
Home Values in the Area
Average Home Value in this Area
Purchase History
| Date | Buyer | Sale Price | Title Company |
|---|---|---|---|
| Curran Ft | -- | None Available | |
| Curran Ft | -- | None Available | |
| Curran Ft | -- | None Available | |
| Curran Scott B | $531,600 | -- | |
| Curran Scott B | $531,600 | -- | |
| Dennett Road Rt | $346,000 | -- | |
| Dennett Road Rt | $346,000 | -- |
Source: Public Records
Mortgage History
| Date | Status | Borrower | Loan Amount |
|---|---|---|---|
| Previous Owner | Dennett Road Rt | $164,686 | |
| Previous Owner | Dennett Road Rt | $100,000 | |
| Previous Owner | Dennett Road Rt | $417,000 |
Source: Public Records
Tax History
| Year | Tax Paid | Tax Assessment Tax Assessment Total Assessment is a certain percentage of the fair market value that is determined by local assessors to be the total taxable value of land and additions on the property. | Land | Improvement |
|---|---|---|---|---|
| 2025 | $11,106 | $1,227,200 | $920,000 | $307,200 |
| 2024 | $11,400 | $1,272,300 | $989,000 | $283,300 |
| 2023 | $9,467 | $946,700 | $690,000 | $256,700 |
| 2022 | $9,186 | $873,200 | $632,500 | $240,700 |
| 2021 | $8,459 | $811,800 | $575,000 | $236,800 |
| 2020 | $9,480 | $912,400 | $713,000 | $199,400 |
| 2019 | $10,170 | $946,900 | $747,500 | $199,400 |
| 2018 | $9,548 | $866,400 | $667,000 | $199,400 |
| 2017 | $9,286 | $843,400 | $644,000 | $199,400 |
| 2016 | $8,668 | $780,900 | $598,000 | $182,900 |
| 2015 | $8,652 | $780,900 | $598,000 | $182,900 |
| 2014 | $8,385 | $756,100 | $575,000 | $181,100 |
Source: Public Records
Map
Nearby Homes
- 59 Harbor Ave
- 4 Ballast Ln
- 349 Ocean Ave
- 10 Redstone Ln
- 55 Brackett Place Unit B
- 7 Lee St Unit 1
- 9 Darling St
- 41 Atlantic Ave Unit 3
- 41 Atlantic Ave Unit 1
- 23 Wyman Rd
- 26 Summer St Unit 1
- 7 Cottage St
- 45 Pleasant St
- 66 Pleasant St Unit 2
- 7 Mechanic Ct
- 290 Washington St Unit A
- 8 Franklin St Unit 19
- 132 Elm St
- 132 Elm St Unit 132
- 3 Frost Ln Unit 1
Your Personal Tour Guide
Ask me questions while you tour the home.