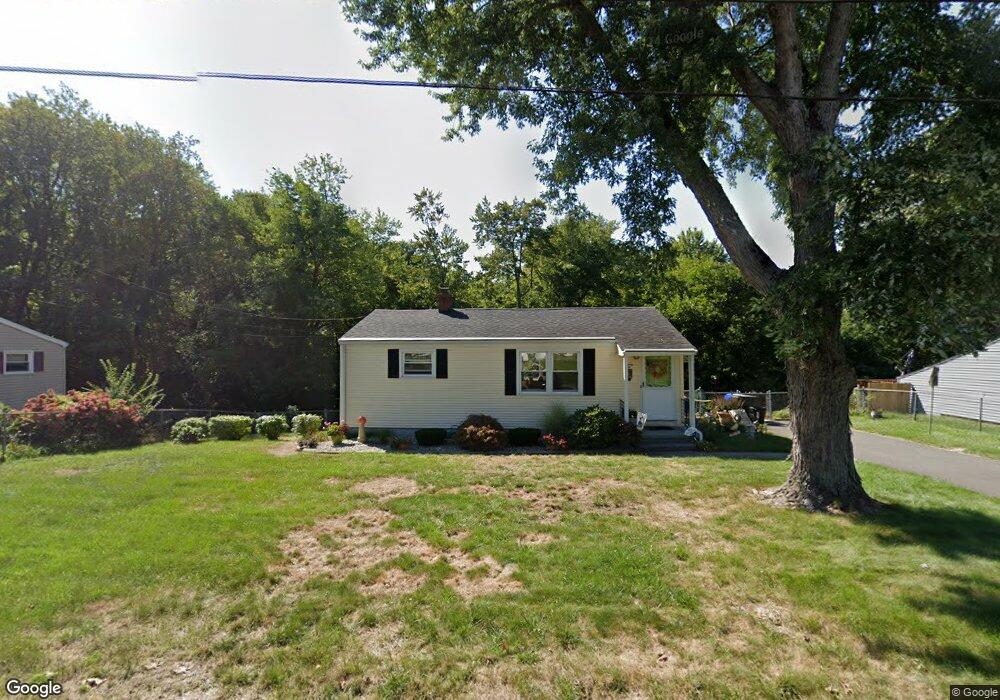
22 Dennis St Springfield, MA 01118
East Forest Park NeighborhoodEstimated Value: $256,333 - $279,000
3
Beds
1
Bath
816
Sq Ft
$329/Sq Ft
Est. Value
About This Home
This home is located at 22 Dennis St, Springfield, MA 01118 and is currently estimated at $268,583, approximately $329 per square foot. 22 Dennis St is a home located in Hampden County with nearby schools including Frederick Harris Elementary School, M Marcus Kiley Middle, and Springfield High School of Science and Technology.
Ownership History
Date
Name
Owned For
Owner Type
Purchase Details
Closed on
Jul 31, 1990
Sold by
Russell William A
Bought by
Dambrosio Jean J
Current Estimated Value
Home Financials for this Owner
Home Financials are based on the most recent Mortgage that was taken out on this home.
Original Mortgage
$47,000
Interest Rate
10.01%
Mortgage Type
Purchase Money Mortgage
Create a Home Valuation Report for This Property
The Home Valuation Report is an in-depth analysis detailing your home's value as well as a comparison with similar homes in the area
Home Values in the Area
Average Home Value in this Area
Purchase History
| Date | Buyer | Sale Price | Title Company |
|---|---|---|---|
| Dambrosio Jean J | $87,000 | -- |
Source: Public Records
Mortgage History
| Date | Status | Borrower | Loan Amount |
|---|---|---|---|
| Closed | Dambrosio Jean J | $46,500 | |
| Closed | Dambrosio Jean J | $47,000 |
Source: Public Records
Tax History
| Year | Tax Paid | Tax Assessment Tax Assessment Total Assessment is a certain percentage of the fair market value that is determined by local assessors to be the total taxable value of land and additions on the property. | Land | Improvement |
|---|---|---|---|---|
| 2025 | $2,860 | $182,400 | $41,900 | $140,500 |
| 2024 | $2,846 | $177,200 | $41,900 | $135,300 |
| 2023 | $2,921 | $171,300 | $43,600 | $127,700 |
| 2022 | $2,657 | $141,200 | $43,600 | $97,600 |
| 2021 | $2,495 | $132,000 | $39,600 | $92,400 |
| 2020 | $2,447 | $125,300 | $39,600 | $85,700 |
| 2019 | $2,466 | $125,300 | $39,600 | $85,700 |
| 2018 | $2,478 | $125,900 | $39,600 | $86,300 |
| 2017 | $2,340 | $119,000 | $39,600 | $79,400 |
| 2016 | $2,039 | $103,700 | $39,600 | $64,100 |
| 2015 | $1,861 | $94,600 | $39,600 | $55,000 |
Source: Public Records
Map
Nearby Homes
- 647 Plumtree Rd
- 101 Regal St
- 37 Chesterfield Ave
- 509 Plumtree Rd
- 384 Abbott St
- 55 Allen St
- 75 Gillette Cir
- 120 Bridle Path Rd
- 19 Manor Ct Unit 19
- 7 Ashbrook St
- 47 Hartford Terrace
- 55 Old Farm Rd
- 54 S Shore Dr
- 125 Manor Ct Unit 125
- 79 Arvilla St
- 79 Roosevelt Ave
- 17 Pebble Mill Rd
- 86 Talmadge Dr
- 85 Talmadge Dr
- 81 W Crystal Brook Dr
Your Personal Tour Guide
Ask me questions while you tour the home.