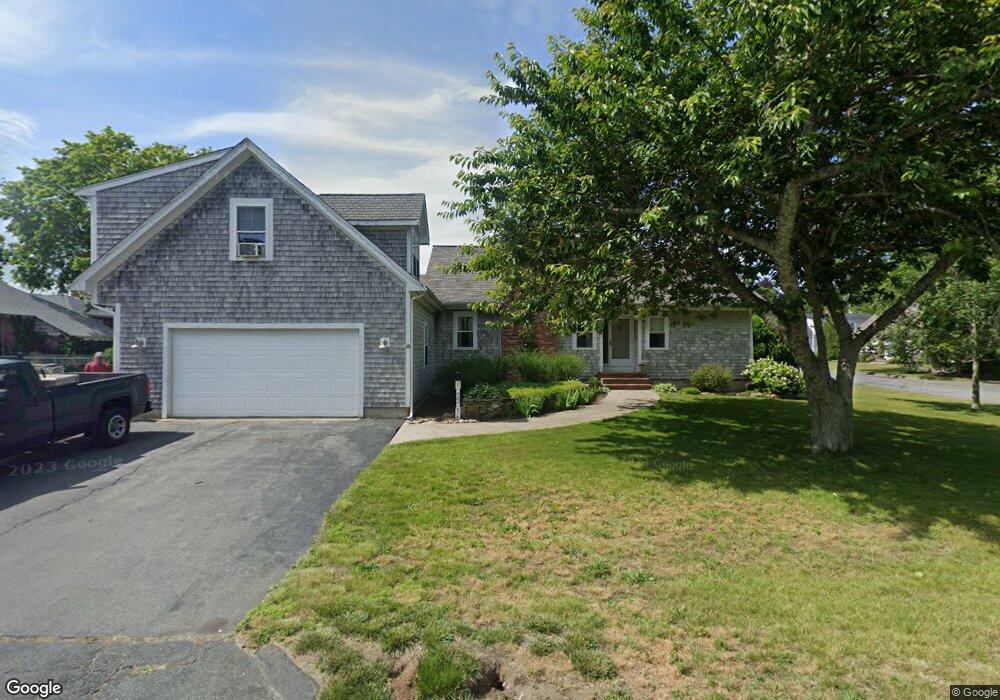
22 Doane St Fairhaven, MA 02719
Estimated Value: $496,000 - $694,573
3
Beds
3
Baths
1,805
Sq Ft
$347/Sq Ft
Est. Value
About This Home
This home is located at 22 Doane St, Fairhaven, MA 02719 and is currently estimated at $626,143, approximately $346 per square foot. 22 Doane St is a home located in Bristol County with nearby schools including Fairhaven High School, City On A Hill Charter Public School New Bedford, and St. Joseph School.
Ownership History
Date
Name
Owned For
Owner Type
Purchase Details
Closed on
Feb 10, 2003
Sold by
Bordwick Martin B and Bordwick Martin
Bought by
Pond Christopher and Pond Heidi P
Current Estimated Value
Home Financials for this Owner
Home Financials are based on the most recent Mortgage that was taken out on this home.
Original Mortgage
$110,000
Interest Rate
5.99%
Mortgage Type
Purchase Money Mortgage
Create a Home Valuation Report for This Property
The Home Valuation Report is an in-depth analysis detailing your home's value as well as a comparison with similar homes in the area
Home Values in the Area
Average Home Value in this Area
Purchase History
| Date | Buyer | Sale Price | Title Company |
|---|---|---|---|
| Pond Christopher | $200,000 | -- |
Source: Public Records
Mortgage History
| Date | Status | Borrower | Loan Amount |
|---|---|---|---|
| Open | Pond Christopher | $10,000 | |
| Open | Pond Christopher | $90,000 | |
| Closed | Pond Christopher | $110,000 | |
| Previous Owner | Pond Christopher | $47,000 |
Source: Public Records
Tax History
| Year | Tax Paid | Tax Assessment Tax Assessment Total Assessment is a certain percentage of the fair market value that is determined by local assessors to be the total taxable value of land and additions on the property. | Land | Improvement |
|---|---|---|---|---|
| 2025 | $53 | $568,800 | $253,000 | $315,800 |
| 2024 | $5,109 | $553,500 | $253,000 | $300,500 |
| 2023 | $4,986 | $501,100 | $218,300 | $282,800 |
| 2022 | $4,810 | $470,600 | $198,900 | $271,700 |
| 2021 | $2,778 | $412,700 | $180,900 | $231,800 |
| 2020 | $4,564 | $412,700 | $180,900 | $231,800 |
| 2019 | $4,312 | $369,500 | $155,100 | $214,400 |
| 2018 | $4,182 | $351,100 | $147,600 | $203,500 |
| 2017 | $5,623 | $338,800 | $142,000 | $196,800 |
| 2016 | $3,902 | $320,400 | $139,300 | $181,100 |
| 2015 | $3,849 | $316,800 | $139,300 | $177,500 |
Source: Public Records
Map
Nearby Homes
- 32 Cedar St
- 32 Green St
- 2 Washburn Ave
- 11 Lawton St
- 24 Middle St
- 58 Washington St
- 0 Nulands Neck Unit 73286360
- 8 Washington St
- 145 Pleasant St
- 8 Manor Dr
- 58 Bayview Ave
- 39 Christian St
- 77 Adams St
- 181 Washington St
- 27 Bayview Ave
- 9 Abbott St
- 67 Bridge St
- 9 Cleveland St
- 15 Bayview Ave
- 138 Main St Unit 13
Your Personal Tour Guide
Ask me questions while you tour the home.